Press Release 18/09/2023
DEATH STATISTICS I/2023
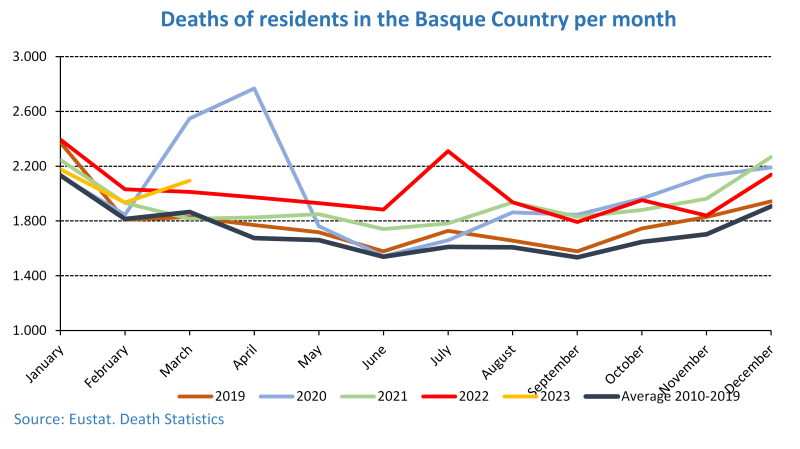
Deaths fell by 3.6% in the first quarter of 2023 in the Basque Country
Deaths due to COVID-19 were down 90.5% and the lowest value was obtained in the first quarter, with 74 deaths.
In the first quarter of 2023 the number of deaths in the Basque Country stood at 6,207, 3.6% down on the same period of the previous year, according to Eustat data. If we compare this data with previous years, we see that in the first quarter of 2023, the number of deaths was lower than in 2022 (6,439) and 2020 (6,522), but higher than in 2021 (5,994), 2019 (6,011) and the average for the 2010-2019 period (5,813).
Deaths fell in all three provinces, Bizkaia standing out with 3,281, a decrease of 4.8%. There were 800 deaths in Álava, down 3.8%, and 2,126 in Gipuzkoa, a fall of 1.6%. By sex, 3,170 women and 3,037 men died, which was a decrease of 3.4% for women and 3.9% for men.
Amongst the deaths that occurred in this first quarter, 8 corresponded to children under 1 year of age (0.1%) and 113 to centenarians (1.8%). Additionally, 64.9% of those who died were aged between 80 and 99 years old.
Deaths by territory of residence, age, sex and month of death (1). 2023/I


| | I/2023 | IV/2022 | I/2022 |
| | NO. | % | NO. | % | Increase % | NO. | % | Increase % |
| DEATHS | 6.207 | 100,0 | 5.930 | 100,0 | 4,7 | 6.439 | 100,0 | -3,6 |
| | | | | | | | | |
| Territory of residence | | | | | | | | |
| Araba / Álava | 800 | 12,9 | 786 | 13,3 | 1,8 | 832 | 12,9 | -3,8 |
| Bizkaia | 3.281 | 52,9 | 3.211 | 54,1 | 2,2 | 3.447 | 53,5 | -4,8 |
| Gipuzkoa | 2.126 | 34,3 | 1.933 | 32,6 | 10,0 | 2.160 | 33,5 | -1,6 |
| | | | | | | | | |
| Age | | | | | | | | |
| Under 1 years | 8 | 0,1 | 11 | 0,2 | -27,3 | 11 | 0,2 | -27,3 |
| 1-19 years | 9 | 0,1 | 8 | 0,1 | 12,5 | 8 | 0,1 | 12,5 |
| 20-39 years | 35 | 0,6 | 38 | 0,6 | -7,9 | 53 | 0,8 | -34,0 |
| 40-59 years | 333 | 5,4 | 389 | 6,6 | -14,4 | 399 | 6,2 | -16,5 |
| 60-79 years | 1.683 | 27,1 | 1.618 | 27,3 | 4,0 | 1.828 | 28,4 | -7,9 |
| 80-99 years | 4.026 | 64,9 | 3.772 | 63,6 | 6,7 | 4.028 | 62,6 | 0,0 |
| 100 or more years | 113 | 1,8 | 94 | 1,6 | 20,2 | 112 | 1,7 | 0,9 |
| | | | | | | | | |
| Men | 3.037 | 100,0 | 2.923 | 100,0 | 3,9 | 3.159 | 100,0 | -3,9 |
| Under 1 years | 5 | 0,2 | 8 | 0,3 | -37,5 | 7 | 0,2 | -28,6 |
| 1-19 years | 4 | 0,1 | 6 | 0,2 | -33,3 | 4 | 0,1 | 0,0 |
| 20-39 years | 22 | 0,7 | 23 | 0,8 | -4,3 | 24 | 0,8 | -8,3 |
| 40-59 years | 221 | 7,3 | 255 | 8,7 | -13,3 | 246 | 7,8 | -10,2 |
| 60-79 years | 1.067 | 35,1 | 1.044 | 35,7 | 2,2 | 1.154 | 36,5 | -7,5 |
| 80-99 years | 1.703 | 56,1 | 1.582 | 54,1 | 7,6 | 1.711 | 54,2 | -0,5 |
| 100 or more years | 15 | 0,5 | 5 | 0,2 | 200,0 | 13 | 0,4 | 15,4 |
| | | | | | | | | |
| Women | 3.170 | 100,0 | 3.007 | 100,0 | 5,4 | 3.280 | 100,0 | -3,4 |
| Under 1 years | 3 | 0,1 | 3 | 0,1 | 0,0 | 4 | 0,1 | -25,0 |
| 1-19 years | 5 | 0,2 | 2 | 0,1 | 150,0 | 4 | 0,1 | 25,0 |
| 20-39 years | 13 | 0,4 | 15 | 0,5 | -13,3 | 29 | 0,9 | -55,2 |
| 40-59 years | 112 | 3,5 | 134 | 4,5 | -16,4 | 153 | 4,7 | -26,8 |
| 60-79 years | 616 | 19,4 | 574 | 19,1 | 7,3 | 674 | 20,5 | -8,6 |
| 80-99 years | 2.323 | 73,3 | 2.190 | 72,8 | 6,1 | 2.317 | 70,6 | 0,3 |
| 100 or more years | 98 | 3,1 | 89 | 3,0 | 10,1 | 99 | 3,0 | -1,0 |
| | | | | | | | | |
| MONTH OF DEATH | | | | | | | | |
| January | 2.177 | 35,1 | | | | 2.394 | 37,2 | -9,1 |
| February | 1.935 | 31,2 | | | | 2.032 | 31,6 | -4,8 |
| March | 2.095 | 33,8 | | | | 2.013 | 31,3 | 4,1 |
| (1)The data for the current quarter is provisional. The variations are over the current quarter | | | | | | | | |
| | | | | | | | | |
Date September 18, 2023
Source: Eustat. Death statistics
The main causes of death were tumours and circulatory system diseases, which caused the deaths of 1,621 and 1,594 individuals respectively, which means that together they accounted for 51.8% of deaths. Diseases of the respiratory system were the third cause of death resulting in 543 deaths (8.7%). Diseases of the nervous system were the fourth cause of death with 404 deaths (6.5%). Diseases of the digestive system caused 303 deaths (4.9%).
The cause of death continued to vary according to sex. Among men, tumours caused more deaths than diseases of the circulatory system, whilst among women the main cause of death was diseases of the circulatory system, followed by tumours in second place.
Deaths by cause of death and sex (1). 2023/I
| | I/2023 | IV/2022 | I/2022 |
| | NO. | % | NO. | % | Increase % | NO. | % | Increase % |
| DEATHS | 6.207 | 100,0 | 5.930 | 100,0 | 4,7 | 6.439 | 100,0 | -3,6 |
| | | | | | | | | |
| Cause of death | | | | | | | | |
| Total | | | | | | | | |
| Tumors | 1.621 | 26 | 1.634 | 28 | -1 | 1.572 | 24 | 3,1 |
| Circulatory system | 1.594 | 25,7 | 1.433 | 24,2 | 11,2 | 1.515 | 23,5 | 5,2 |
| Respiratory system | 543 | 8,7 | 463 | 7,8 | 17,3 | 376 | 5,8 | 44,4 |
| Nervous system | 404 | 6,5 | 401 | 6,8 | 0,7 | 416 | 6,5 | -2,9 |
| Digestive system | 303 | 4,9 | 285 | 4,8 | 6,3 | 272 | 4,2 | 11,4 |
| Other causes | 1.742 | 28,1 | 1.714 | 28,9 | 1,6 | 2.288 | 35,5 | -23,9 |
| COVID-19 confirmed | 74 | 1,2 | 200 | 3,4 | -63,0 | 778 | 12,1 | -90,5 |
| COVID-19 probable | 0 | 0,0 | 1 | 0,0 | -100,0 | 6 | 0,1 | -100,0 |
| Other causes | 1.668 | 26,9 | 1.513 | 25,5 | 10,2 | 1.504 | 23,4 | 10,9 |
| | | | | | | | | |
| Men | | | | | | | | |
| Tumors | 983 | 32 | 973 | 33 | 1 | 884 | 28 | 11,2 |
| Circulatory system | 728 | 24,0 | 668 | 22,9 | 9,0 | 710 | 22,5 | 2,5 |
| Respiratory system | 279 | 9,2 | 242 | 8,3 | 15,3 | 210 | 6,6 | 32,9 |
| Nervous system | 158 | 5,2 | 172 | 5,9 | -8,1 | 151 | 4,8 | 4,6 |
| Digestive system | 159 | 5,2 | 155 | 5,3 | 2,6 | 137 | 4,3 | 16,1 |
| Other causes | 730 | 24,0 | 713 | 24,4 | 2,4 | 1.067 | 33,8 | -31,6 |
| COVID-19 confirmed | 36 | 1,2 | 99 | 3,4 | -63,6 | 437 | 13,8 | -91,8 |
| COVID-19 probable | 0 | 0,0 | 1 | 0,0 | -100,0 | 3 | 0,1 | -100,0 |
| Other causes | 694 | 22,9 | 613 | 21,0 | 13,2 | 627 | 19,8 | 10,7 |
| | | | | | | | | |
| Women | | | | | | | | |
| Tumors | 638 | 20 | 661 | 22 | -3 | 688 | 21 | -7,3 |
| Circulatory system | 866 | 27,3 | 765 | 25,4 | 13,2 | 805 | 24,5 | 7,6 |
| Respiratory system | 264 | 8,3 | 221 | 7,3 | 19,5 | 166 | 5,1 | 59,0 |
| Nervous system | 246 | 7,8 | 229 | 7,6 | 7,4 | 265 | 8,1 | -7,2 |
| Digestive system | 144 | 4,5 | 130 | 4,3 | 10,8 | 135 | 4,1 | 6,7 |
| Other causes | 1.012 | 31,9 | 1.001 | 33,3 | 1,1 | 1.221 | 37,2 | -17,1 |
| COVID-19 confirmed | 38 | 1,2 | 101 | 3,4 | -62,4 | 341 | 10,4 | -88,9 |
| COVID-19 probable | 0 | 0,0 | 0 | 0,0 | 0,0 | 3 | 0,1 | -100,0 |
| Other causes | 974 | 30,7 | 900 | 29,9 | 8,2 | 877 | 26,7 | 11,1 |
| (1)The data for the current quarter is provisional. The variations are over the current quarter | | | | | | | | |
| | | | | | | | | |
Date September 18, 2023
Source: Eustat. Death statistics
Population growth in the Basque Country in the first quarter of 2023 was negative, with a population decrease of 3,094. The population fell in all three provinces: by 1,701 people in Bizkaia, 1,084 in Gipuzkoa and 309 in Álava.
There were 74 deaths as a result of COVID-19 in the first quarter of 2023
COVID-19 caused a total of 74 deaths, all of which were from confirmed COVID-19, which was a 90.5% decrease. There were a further 24 deaths where COVID-19 was among the certified causes of death, but without being the main cause.
Deaths of the Basque Country by provinces, municipality (>40,000 hab.) of residence, sex and age according to causes of death related to COVID-19. 2023/I
| | Total deaths | Total COVID-19 | COVID-19 confirmed | COVID-19 probable |
| | | | | |
| Basque Country | 6.207 | 74 | 74 | 0 |
| | | | | |
| Historic Territories of Residence | | | | |
| Araba/Álava | 800 | 4 | 4 | 0 |
| Bizkaia | 3.281 | 47 | 47 | 0 |
| Gipuzkoa | 2.126 | 23 | 23 | 0 |
| | | | | |
| Municipality of residence (>40,000 inhabitants) | | | | |
| Barakaldo | 259 | 6 | 6 | 0 |
| Basauri | 147 | 0 | 0 | 0 |
| Bilbao | 1.062 | 15 | 15 | 0 |
| Donostia / San Sebastian | 576 | 3 | 3 | 0 |
| Getxo | 180 | 2 | 2 | 0 |
| Irun | 160 | 2 | 2 | 0 |
| Portugalete | 153 | 2 | 2 | 0 |
| Santurtzi | 153 | 0 | 0 | 0 |
| Vitoria-Gasteiz | 587 | 2 | 2 | 0 |
| | | | | |
| Sex | | | | |
| Man | 3.037 | 36 | 36 | 0 |
| Woman | 3.170 | 38 | 38 | 0 |
| | | | | |
| Age | | | | |
| Aged under 40 | 52 | 0 | 0 | 0 |
| From 40 to 59 years | 333 | 1 | 1 | 0 |
| From 60 to 79 years | 1.683 | 16 | 16 | 0 |
| 80 or older | 4.139 | 57 | 57 | 0 |
Date September 18, 2023
Source: Eustat. Death statistics
By province, the highest figure corresponded to Bizkaia, with 47, followed by Gipuzkoa with 23 and Álava with 4. As regards the capitals, Bilbao stands out with 15 deaths caused by COVID-19, followed by San Sebastián with 3 and Vitoria-Gasteiz with 2. The municipality of Barakaldo had 6 deaths resulting from this cause.
The number of deaths of women (38) exceeded those of men (36), while, by age, the most affected groups were those aged over 80 (57), followed by those aged 60-79 (16).
The majority of these deaths due to COVID-19 occurred in Basque hospitals (82.4%), followed by at home (9.5%) and residential care homes (8.1%).
For further information:
Eustat - Euskal Estatistika Erakundea / Basque Statistics Institute
C/ Donostia-San Sebastián, 1 01010 Vitoria-Gasteiz
Press service: servicioprensa@eustat.es Tel.: 945 01 75 62