Press Release 28/11/2024
BASQUE BUSINESS STRUCTURE AND DEMOGRAPHY. 01/01/2024
The number of people employed in the Basque Country has increased by 3.8% over the last five years
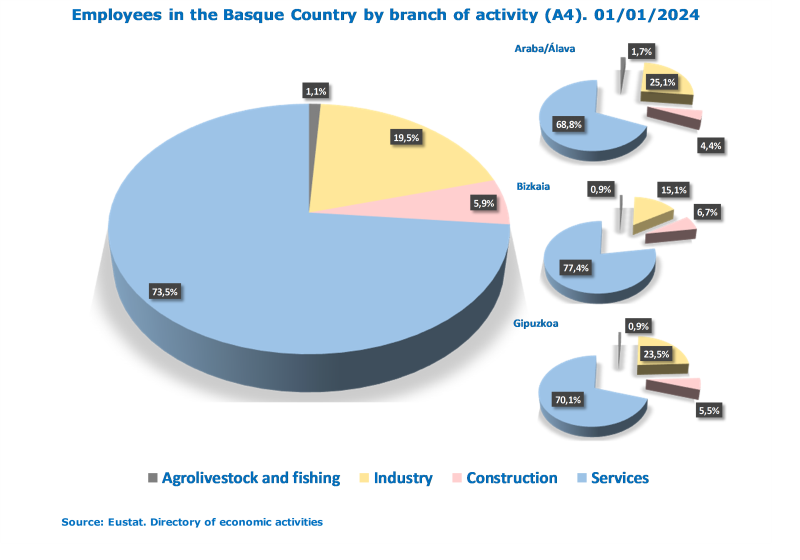
Nearly three in four employees worked in the services sector
On 1 January 2024, there were 147,524 companies operating in the different sectors of activity in the Basque Country, which represented a decrease of 1,546 companies compared to the previous year (-1.0%), according to Eustat data. These companies carried out their activities in 165,214 establishments (factories, businesses, offices, etc.) that registered a 1.9% increase in the number of people employed. If we look at the last five years, the rise in employment was 3.8%, and there was a positive balance every year, with the exception of 2021, which saw a drop of 1.3%.
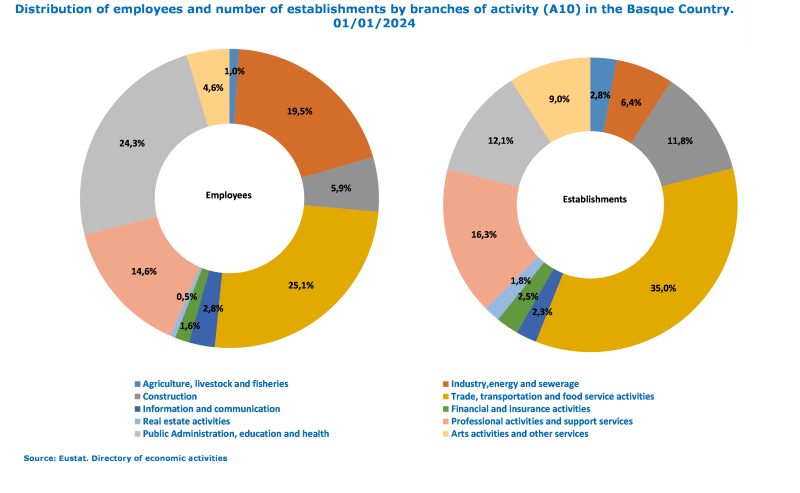
More than three quarters of establishments in the Basque Country were concentrated in the services sector (79.0%), employing 73.6% of people. Bizkaia exceeded the figure for the Basque Country with 80.8% of establishments and 77.4% of people employed in this sector. In Álava and Gipuzkoa, it was the industrial sector that stood out with 7.9% of establishments and 25.1% of employees and 7.6% and 23.5%, respectively.
Three sectors stood out as having above average growth in employment: Information & Communications (4.9%), Arts Activities and Other Services (3.3%) and Professional Activities and Support Services (2.3%). Only one sector saw a drop in the number of people employed, namely Agriculture and Fishing, with employment down 4.4% this year.
Percentage distribution of employed persons and year-on-year variation in the Basque Country by branches of activity (A10) according to historical territory. 01/01/2024


| | Basque Country | Araba/Álava | Bizkaia | Gipuzkoa |
| | Individuals employed | Var. % | Individuals employed | Var. % | Individuals employed | Var. % | Individuals employed | Var. % |
| Total | 100,0 | 1,9 | 100,0 | 2,3 | 100,0 | 2,1 | 100,0 | 1,4 |
| Agriculture, forestry and fishing | 1,0 | -4,4 | 1,7 | -6,1 | 0,9 | -2,9 | 0,9 | -4,9 |
| Industry, energy and sanitation | 19,5 | 1,9 | 25,1 | 1,4 | 15,1 | 2,4 | 23,5 | 1,7 |
| Construction | 5,9 | 1,7 | 4,4 | 1,9 | 6,7 | 1,9 | 5,5 | 1,1 |
| Trade, transport and hotel industry | 25,1 | 1,5 | 22,9 | 1,6 | 25,7 | 1,9 | 25,4 | 1,0 |
| Information and communication | 2,8 | 4,9 | 1,8 | 2,2 | 3,7 | 6,1 | 2,0 | 2,6 |
| Financial and insurance activities | 1,6 | 0,3 | 1,0 | -0,5 | 1,9 | 0,7 | 1,3 | -0,4 |
| Real estate activities | 0,5 | 1,9 | 0,3 | 5,3 | 0,6 | 1,6 | 0,5 | 1,2 |
| Professional activities and support services | 14,6 | 2,3 | 12,8 | 5,9 | 16,5 | 1,8 | 12,7 | 1,6 |
| Public admin., education and health | 24,3 | 1,8 | 25,7 | 3,0 | 24,2 | 1,5 | 23,6 | 1,6 |
| Arts activities and other services | 4,6 | 3,3 | 4,1 | 1,4 | 4,8 | 5,2 | 4,6 | 1,2 |
Date November 28, 2024
Source: Eustat. Directory of Economic Activities
As regards structure, the largest sector, according to the number of establishments, was Trade, Transportation and Hospitality (35.0% of the total), followed by Professional Activities and Support Services (16.3%), Public Administration, Education and Health (12.1%) and Construction (11.8%).
The distribution of establishments according to their size remained very similar to previous years. Barely 2,660 establishments, 1.6% of the total, were establishments with an average of 50 or more employees, despite accounting for 42.5% of the total number of employees as a whole. On the other hand, 118,223 establishments, almost three quarters, were small (fewer than 3 employees) and accounted for 15.0% of the total. It is in these small establishments where the loss of employment has been concentrated, with 1,947 fewer jobs. In contrast, employment grew most in the strata of 50 and more employees and 20 to 49 employees, gaining 11,879 and 5,328 jobs respectively.
As regards the average size of the establishments, by large activity branches, the greatest concentration of employed individuals was in the Industry, Energy and Sewerage sector, with an average size of 17.5 in the Basque Country as a whole. Álava stood out with 21.3 people, while the average size in Bizkaia and Gipuzkoa was 15.9 and 17.5 people per establishment, respectively.
Percentage distribution of people employed in the Basque Country by branch of activity (A10) according to historical territory and sex. 01/01/2024
| | Basque Country | Araba/Álava | Bizkaia | Gipuzkoa |
| | Men | Women | Men | Women | Men | Women | Men | Women |
| Total | 55,0 | 45,0 | 56,1 | 43,9 | 54,6 | 45,4 | 55,0 | 45,0 |
| Agriculture, forestry and fishing | 78,8 | 21,2 | 77,1 | 22,9 | 82,4 | 17,6 | 75,0 | 25,0 |
| Industry, energy and sanitation | 78,8 | 21,2 | 79,2 | 20,8 | 79,1 | 20,9 | 78,1 | 21,9 |
| Construction | 89,0 | 11,0 | 88,2 | 11,8 | 88,9 | 11,1 | 89,7 | 10,3 |
| Trade, transport and hotel industry | 53,6 | 46,4 | 53,6 | 46,4 | 54,1 | 45,9 | 52,7 | 47,3 |
| Information and communication | 64,6 | 35,4 | 66,8 | 33,2 | 64,4 | 35,6 | 64,0 | 36,0 |
| Financial and insurance activities | 43,4 | 56,6 | 44,2 | 55,8 | 44,2 | 55,8 | 41,3 | 58,7 |
| Real estate activities | 45,7 | 54,3 | 36,6 | 63,4 | 46,6 | 53,4 | 47,2 | 52,8 |
| Professional activities and support services | 50,1 | 49,9 | 50,5 | 49,5 | 50,6 | 49,4 | 48,9 | 51,1 |
| Public admin., education and health | 32,7 | 67,3 | 33,3 | 66,7 | 33,4 | 66,6 | 31,3 | 68,7 |
| Arts activities and other services | 45,4 | 54,6 | 44,9 | 55,1 | 46,6 | 53,4 | 43,9 | 56,1 |
Date November 28, 2024
Source: Eustat. Directory of Economic Activities
By sex, 45.0% of people employed in the Basque Country in 2023 were women, a similar percentage to the previous year. The sectors with most female employees were Healthcare and Social Services (78.1% women), Education (67.0%) and Services (62.6%). By contrast, the sectors in which the majority of employees were male were Construction (89.0%), and Industrial and Primary, with approximately 79% in both cases.
COMPANIES
Of the total of companies (legal units) that provide support for establishments’ activities, 96.6% were based in the Basque Country and the remaining 3.4% (4,974) were in the rest of Spain. Of those with 100 employees or more, the percentage based in the Basque Country reached 77.0%. Bizkaia accounted for slightly more than half the companies based in the Basque Country, with 74,178 companies (50.3%); Gipuzkoa had 48,331 (32.8%) and Álava 20,041 (13.6%).
The average size of companies in the Basque Country remained stable, with 6.4 employees per company and 5.7 per establishment. Companies under individual ownership only had 1.4 employees, both per company and establishment, whereas for the other legal forms these averages reached 13.5 and 10.7 employees, respectively.
BUSINESS DEMOGRAPHICS
Regarding the age of the companies, the fact that many of these Basque companies are relatively new stands out. 30.7% of companies operating in the Basque Country were five years old or less and the percentage of those in operation for two years or less stood at 14.0%.
Regarding rotation, and taking into account establishment openings and closures, 12,484 began and 13,857 ceased trading during 2023, with a negative balance of 1,373 establishments. The establishment birth rate (quotient between those created and the stock) was 7.6% and the death rate was 8.4%. As a result, the net growth rate was negative (-0.8%).
The greatest rotation was seen in the branches of Trade, Transportation and Hospitality, with 29.9% of new openings and 34.0% of closures; 17.4% of new openings and 17.3% of closures in Construction; and Professional Activities and Support Services, with figures of 16.5% and 16.0%, respectively.
In the analysis of demography by legal status, the establishments created under the individual ownership formula stand out for having generated 66.4% of new openings and 71.4% of closures.
In terms of the number of people employed, individually-owned establishments accounted for 40.4% of people employed in new establishments, while establishments that are now closed employed 48.6%. Limited Companies were also noteworthy, with 37.4% of jobs created in establishments opened and 30.9% of jobs lost in establishment closures.
Establishment demographics in the Basque Country. 01/01/2024
| | New entries | Cancelled entries |
| Total | 12.484 | 13.857 |
| | | |
| By Activity | | |
| Agriculture, forestry and fishing | 190 | 532 |
| Industry, energy and sanitation | 520 | 691 |
| Construction | 2.166 | 2.392 |
| Trade, transport and hotel industry | 3.727 | 4.710 |
| Information and communication | 483 | 417 |
| Financial and insurance activities | 292 | 305 |
| Real estate activities | 234 | 222 |
| Professional activities and support services | 2.058 | 2.221 |
| Public admin., education and health | 1.549 | 1.277 |
| Arts activities and other services | 1.265 | 1.090 |
| | | |
| By legal personality | | |
| Natural person | 8.289 | 9.898 |
| Partnership | 210 | 308 |
| Limited company | 3.051 | 2.631 |
| Other companies and associations | 895 | 986 |
| Other legal forms | 39 | 34 |
Date November 28, 2024
Source: Eustat
In terms of establishment size, the most dynamic stratum was that of 2 employees or under, as has become the norm. This stratum alone accounted for 90.0% of all new openings and 91.5% of all closures.
On the contrary, the stratum of large establishments, those with 50 or more employees, only accounted for 0.1% of new openings and 0.1% of closures. On the other hand, it accounted for 8.3% of all jobs created in new establishments and 4.6% of all jobs lost in establishment closures.
For further information:
Eustat - Euskal Estatistika Erakundea / Basque Statistics Institute
C/ Donostia-San Sebastián, 1 01010 Vitoria-Gasteiz
Press Service: servicioprensa@eustat.eus Tel.: 945 01 75 62