Press Release 18/01/2023
MUNICIPAL GDP 2020
In 2020, the services sector accounted for more than 70% of the GVA produced by the three provincial capitals of the Basque Country
In all the Basque regions, there was a municipality that stood out for generating at least 22% of the total value added for its region
The Gross Value Added (GVA) generated by the production sectors in the three Basque capitals in 2020 was primarily based on activity in the Services sector, representing 91.7% of their total GVA in the case of Bilbao, 89.4% for San Sebastián and 70.0% for Vitoria-Gasteiz, according to Eustat data.
Comparing the economic structure of the three Basque capitals with the Basque Country as a whole, great similarity can be seen by activity sector. The services sector accounted for more than 70.0% of the total GVA in all of them, with Public Administration, Education and Health services, Trade, Hospitality and Transport, Property Activities and Professional Activities standing out.
Distribution of the Gross Value Added (GVA) of the capitals of the Basque Country by sectors of activity (%). 2020
| | Basque Country | Bilbao | Donostia / San Sebastian | Vitoria-Gasteiz |
| Total | 100,0 | 100,0 | 100,0 | 100,0 |
| AGRICULTURE, FORESTRY AND FISHERIES | 0,8 | 0,0 | 0,0 | 0,2 |
| INDUSTRY AND ENERGY | 22,8 | 3,6 | 5,1 | 25,1 |
| Manufacturing industry | 19,5 | 1,6 | 3,3 | 21,7 |
| CONSTRUCTION | 5,6 | 4,7 | 5,5 | 4,8 |
| SERVICES | 70,8 | 91,7 | 89,4 | 70,0 |
| Trade, accommodation & food services and transport | 18,5 | 17,7 | 15,2 | 16,8 |
| Information and communication | 3,3 | 7,1 | 4,5 | 2,1 |
| Financial and insurance activities | 4,5 | 8,8 | 6,9 | 3,9 |
| Real estate activities | 12,6 | 13,7 | 15,3 | 10,2 |
| Professional activities | 9,5 | 15,7 | 13,4 | 9,5 |
| Public admin., education and health | 19,0 | 23,4 | 29,3 | 24,1 |
| Other service activities | 3,6 | 5,3 | 4,8 | 3,4 |
Date January 18, 2023
Source: Eustat. Municipal GDP
Of the three provincial capitals, it was Vitoria-Gasteiz that had the most similar economic structure to that of the Basque Country as a whole, due to the presence of industrial activities, which represented 25.1% of the GVA for the capital of Álava and 22.8% for the Basque Country.
Municipalities with the highest proportion of GVA within each region
Looking at the municipalities that generated the highest volume of GVA within each region of the Basque Country, there was a municipality that stood out in each one, accounting for over 22.0% of the total for the region.
The province of Álava saw the greatest concentration of GVA in a municipality by region, with all of them representing more than 30.0% of the GVA. Of particular relevance was the municipality of Vitoria-Gasteiz, which generated 93.9% of the GVA for its region, Llanada Alavesa, with the most notable activities being the Manufacture of motor vehicles and Rubber Products. Legutio also stood out, accounting for 60.9% of the GVA for Estribaciones del Gorbea, thanks to industrial production in activities such as Mechanical engineering, Iron and Steel products and the Manufacture of parts for motor vehicles.
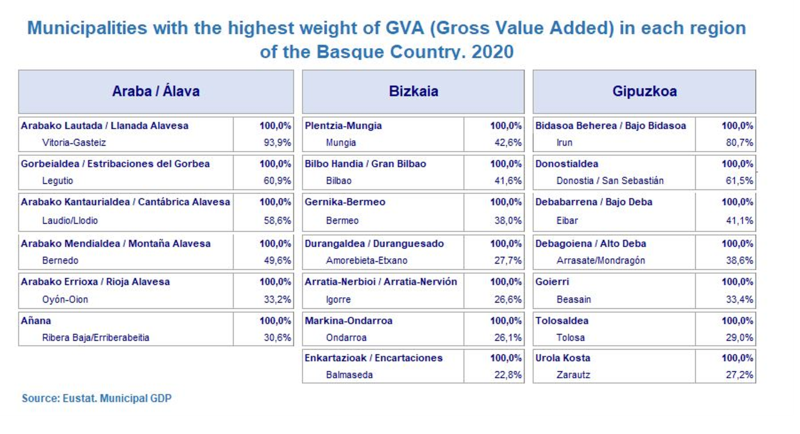
In Gipuzkoa, in the region of Bajo Bidasoa, the municipality of Irún generated 80.7% of the GVA for the region, based primarily on Property Activities, Construction, Trade and activities related to Goods Transport. It was followed by the municipality of Donostia-San Sebastían, which produced 61.5% of the GVA for its region, Donostialdea, and Eibar, with 41.1% of the GVA for Bajo Deba; services activities had a strong presence in both municipalities.
In Bizkaia, compared to the other two provinces, there was a lower concentration of GVA in the different municipalities and regions, with Mungia, in the region of Plentzia-Mungia, achieving the highest proportion, with 42.6% of the region’s GVA, thanks to activities such as Electrical Material & Equipment, Machinery and Property Activities, among others. The municipality with the second highest concentration of GVA in its region was Bilbao, in Gran Bilbao, with 41.6% of the total GVA and an economic structure based on the services sector. Next was the municipality of Bermeo in the region of Gernika-Bermeo, with a weight of 38.0% of the GVA, thanks to the municipality’s strong fishing industry.
Methodological note
Economic activity, measured by the value added generated by the production sectors (primary, industry, construction and services), is linked to the province where their production units are located. Income, on the other hand, is related to individuals and their place of residence.
For further information:
Eustat - Euskal Estatistika Erakundea / Basque Statistics Institute
C/ Donostia-San Sebastián, 1 01010 Vitoria-Gasteiz
Press Service: servicioprensa@eustat.eus Tel.: 945 01 75 62