Press release 31/08/2022
HIGH TECHNOLOGY SECTOR STATISTICS 2020
The high and medium-high technology sector generated 8.9% of value added and 9.3% of people employed in the Basque Country in 2020
This sector spent 73.6% of total internal expenditure on R&D and accounted for 44.7% of companies that carried out R&D
In 2020, the high and medium-high technology sector (HTS) generated 8.9% of the total gross value added of the Basque economy, according to Eustat data. This sector, which covers all activities with a sound technological base and a fast renewal of knowledge, generated 93,732 jobs, 9.3% of the total. The number of companies carrying out these activities was 4,946, with a total turnover of 19,836 million euros.
As regards the high and medium-high technology sector in Spain, the Basque Country accounts for 5.3% of its companies and generates 7.9% of its GVA. However, the high and medium-high technology sector has the greatest weight in the manufacturing industry, accounting for 7.0% of companies and 10.5% of value added.
Main magnitudes from the high technology sector in the Basque Country by province and economic activity (thousands of euros). 2020
| | Enterprises (1) | Turnover | Gross value added cf | Jobs |
| High and medium-high-tech sector | 4.946 | 19.836.024 | 6.391.263 | 93.732 |
| Province | | | | |
| Araba / Álava | 710 | 5.674.656 | 1.113.366 | 16.372 |
| Bizkaia | 2.613 | 6.500.381 | 2.654.140 | 36.664 |
| Gipuzkoa | 1.759 | 7.660.987 | 2.623.757 | 40.696 |
| | | | | |
| High- and medium-high-tech manufacturing industry | 1.502 | 16.538.708 | 4.438.312 | 64.405 |
| High technology | 188 | 2.083.826 | 736.623 | 10.085 |
| Medium-high technology | 1.314 | 14.454.882 | 3.701.689 | 54.320 |
| High-tech or state-of-the-art services | 3.444 | 3.297.316 | 1.952.951 | 29.327 |
(1)The territorial sum of the number of companies may not match the total
They have been counted once in each historical territory in which they have activity and only once in the total of the C.A. from Euskadi
Date August 31, 2022
Source: Eustat. High tecnology scoreboard
In relation to the previous year, the number of businesses increased, up 0.4%. However, job posts were down 1.1%, therefore registering an average of 19 people employed in companies dedicated to this activity in 2020. Turnover and value added decreased by 11.6% and 8.8%, respectively.
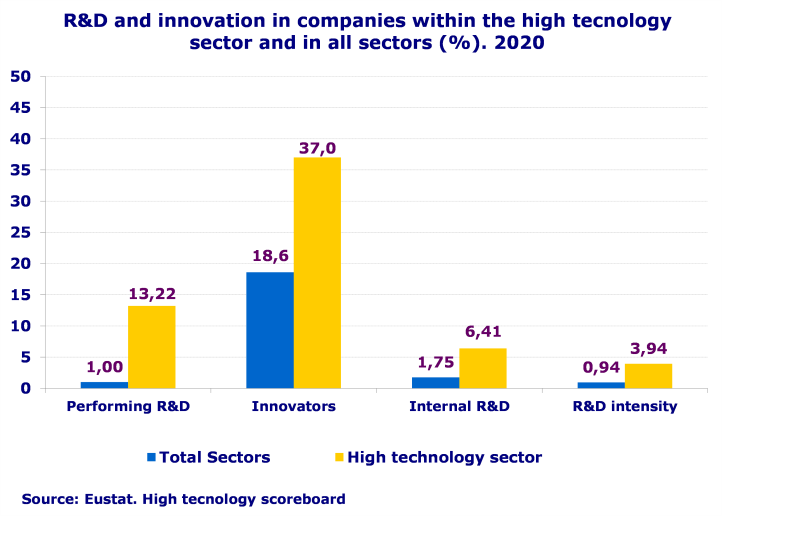
13.2% of companies in the high and medium-high technology sector carried out R&D activities, a percentage that is far higher than the total for all sectors (1.0%). Furthermore, this sector, representing 3.2% of total companies, accounted for 44.7% of those undertaking R&D in the commercial sector and, with 841.8 million euros, carried out 73.6% of the total expenditure on internal R&D in the commercial sector.
With regards to people working in R&D in this sector, it should be pointed out that in 2020 there were 9,731 people employed in “full-time equivalent jobs (FTE)”, 70.5% of personnel dedicated to R&D in the commercial sector, or 49.9% if the comparison is made with personnel dedicated to these activities across all sectors. There were 3,187 women, representing 32.7%. Of the total number of personnel in full time equivalent jobs, 6,527 belonged to the category of researchers; 2,147 were women (32.9%).
Establishments and F.T.E. staff dedicated to R&D within the high technology sector in the Basque Country by province and economic activity according to occupation and sex. 2020
| | Number or establishments | FTE personnel | Researchers FTE |
| | | Total | Women | Women % | Total | Women | Women % |
| TOTAL R&D | 1.531 | 19.510,9 | 7.130,0 | 36,5 | 13.628,7 | 4.953,3 | 36,3 |
| Business Sector R+D | 1.464 | 13.800,5 | 4.244,7 | 30,8 | 9.097,0 | 2.851,2 | 31,3 |
| High and medium-high-tech sector I+D | 654 | 9.731,1 | 3.186,9 | 32,7 | 6.527,0 | 2.146,7 | 32,9 |
| Province | | | | | | | |
| Araba / Álava | 91 | 886,7 | 324,5 | 36,6 | 631,2 | 216,7 | 34,3 |
| Bizkaia | 268 | 3.635,2 | 1.262,1 | 34,7 | 2.563,3 | 892,2 | 34,8 |
| Gipuzkoa | 295 | 5.209,2 | 1.600,3 | 30,7 | 3.332,4 | 1.037,8 | 31,1 |
| | | | | | | | |
| High- and medium-high-tech manufacturing industry R+D | 315 | 3.339,3 | 805,4 | 24,1 | 1.870,7 | 482,8 | 25,8 |
| High technology | 64 | 991,0 | 291,4 | 29,4 | 686,5 | 201,3 | 29,3 |
| Medium-high technology | 251 | 2.348,3 | 514,0 | 21,9 | 1.184,2 | 281,5 | 23,8 |
| High-tech or state-of-the-art services I+D | 339 | 6.391,8 | 2.381,5 | 37,3 | 4.656,3 | 1.663,8 | 35,7 |
E.D.P.: Equivalent to full time
Date August 31, 2022
Source: Eustat. High tecnology scoreboard
Regarding innovation, as with R&D, there were significant differences between the total for all sectors and for the high and medium-high technology sector. In 2020, 37.0% of establishments in the sector were innovators compared to 18.6% of the total for all sectors. For establishments with 10 or more employees these percentages reached 57.7% in the first case and 31.4% in the second.
High and medium-high technology establishments spent a total of 1,459 million euros on innovation activities in 2020, 52.3% of total expenditure across all sectors. Of this expenditure, 1,307 million corresponded to establishments with 10 or more employees, which was 54.9% of the total expenditure by companies of that size on this activity.
This sector allocated a greater proportion of resources towards R&D+i and e-commerce than the average for all sectors as a whole
It was also clear that the high and medium-high technology sector allocated a greater proportion of resources towards R&D+i than the other sectors, observing the “innovation” and “internal R&D” intensity ratios, i.e. the amounts that this sector spends compared to the turnover figure. Specifically, innovation intensity in this sector was 6.41% compared to 1.75% for all economic sectors as a whole. In the case of internal R&D, the ratio was 3.94% for the sector and 0.94% for all the economic sectors.
Internal innovation and R&D intensity from the high technology sector in the Basque Country by province and economic activity (%). 2020
| | Total | 10 or more employees |
| | Innovation Intensity (1) | Internal R&D Intensity (2) | Innovation Intensity (1) | Internal R&D Intensity (2) |
| TOTAL SECTORS | 1,75 | 0,94 | 2,31 | 1,36 |
| High and medium-high tech sector | 6,41 | 3,94 | 6,14 | 3,92 |
| Province | | | | |
| Araba / Álava | 4,21 | 1,50 | 4,27 | 1,49 |
| Bizkaia | 8,02 | 4,59 | 7,55 | 4,56 |
| Gipuzkoa | 6,04 | 4,56 | 5,80 | 4,56 |
| | | | | |
| High- and medium-high-tech manufacturing industry | 3,58 | 1,74 | 3,70 | 1,80 |
| High technology | 7,83 | 2,76 | 8,06 | 2,84 |
| Medium-high technology | 2,76 | 1,55 | 2,86 | 1,60 |
| High-tech or state-of-the-art services | 17,18 | 12,26 | 16,93 | 13,30 |
(1)Innovation Intensity: (Spending on innovation/turnover)*100
(2)Internal R&D intensity: (Spending on internal R&D/turnover)*100
Date August 31, 2022
Source: Eustat. High tecnology scoreboard
Both the use of Information & Communications Technology (ICT) and e-commerce were much more widespread amongst the companies in this sector than in the total of all sectors. In 2020, 51.6% of establishments in this sector participated in e-commerce compared to 26.9% of those in all sectors as a whole.
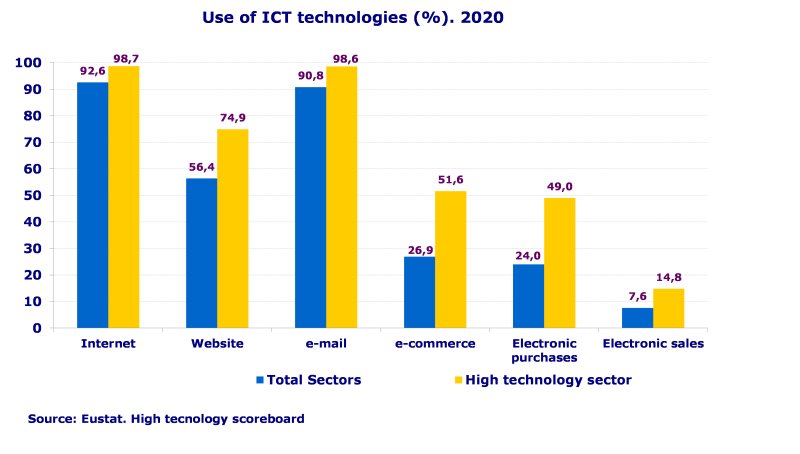
These percentages were determined by the 49.0% of the establishments in this sector that made online purchases, compared to 24.0% of establishments that made online purchases across all sectors; and 14.8% of establishments in the technology sectors that made online sales, a figure that stood at 7.6% in the case of all sectors.
On the other hand, the impact of this sector on the foreign trade of goods was not particularly significant. Whilst exports accounted for 709.7 million euros out of a total of 21,124.2 million, imports stood at 603.1 million out of the 15,868.4 million of total imports. These figures represented 3.4% and 3.8% of the total exports and imports, respectively.
Standing out among the most common products traded in terms of exports were: Machinery and Mechanical Equipment (38.4%), Manufacture of Aircraft and Spacecraft (17.3%) and Electronic material, Radio, TV, and Communications Equipment (14.9%). Of particular note in imports were Electronic Material, Radio, TV and Communications Equipment (40.2%); Scientific Instruments (22.5%); and Manufacture of Aircraft and Spacecraft (10.2%).
Turnover in the high and medium-high technology sector rose by 13.3% since 2010
As of 2010, from a more long-term perspective, this sector has continuously increased its contribution since 2015, with the exception of the last published year, 2020, which marked the beginning of the COVID-19 pandemic.
Since 2010, turnover in the HTS sector has been above 16,800 million euros, having exceeded 20,000 million in 2017 and reaching its record in 2019 with 22,430 million, which represented an increase of 4,918 million in respect of 2010, up 28.1%. However, this figure decreased to 19,836 million in 2020, 11.6% less than the previous year.
For the same period, 2010-2020, the total number of employed people in HTS companies saw a rise of 2,218 people, after having been below 90,000 between 2011 and 2017. During the last year of this analysis, the total figure reached 93,732 people in employment, exceeding the figure recorded in 2010 by 2.4%.
In turn, during the last 10 years the number of High and Medium-High technology companies has remained above the threshold of 4,600, with percentages out of the total of Basque companies standing at around 3%, going from 2.9% in 2010 to 3.2% in 2020. As can be seen, there is a slight percentage increase that translates into 116 more HTS companies than in 2010.
Lastly, the gross value added stood at 6,391 million in 2020, 285 million more than in 2010, since when it had maintained a figure above 5,700 million. In this case, as can be observed in Job Posts and Turnover figures, the record was reached one year prior, in 2019, with 7,011 million euros (14.8% more than in 2010).
Main magnitudes of the high-tech sector. 2010-2020
| | Number of companies | Jobs | Turnover (1) | Gross value added at factor cost (1) |
| 2020 | 4.946 | 93.732 | 19.836.024 | 6.391.263 |
| 2019 | 4.927 | 94.777 | 22.430.228 | 7.010.523 |
| 2018 | 4.881 | 93.458 | 21.336.764 | 6.777.987 |
| 2017 | 4.789 | 89.710 | 20.306.692 | 6.516.869 |
| 2016 | 4.852 | 87.727 | 19.198.452 | 6.251.960 |
| 2015 | 4.787 | 85.100 | 17.696.422 | 5.989.997 |
| 2014 | 4.745 | 84.419 | 16.872.644 | 5.746.375 |
| 2013 | 4.718 | 86.571 | 17.085.535 | 5.806.417 |
| 2012 | 4.646 | 87.746 | 17.847.872 | 6.134.652 |
| 2011 | 4.742 | 89.726 | 18.748.825 | 6.373.258 |
| 2010 | 4.830 | 91.514 | 17.511.934 | 6.106.721 |
(1)Thousand euros
Date August 31, 2020
Source: Eustat. High tecnology scoreboard
Methodological note:
The sectors that belong to the high technology sector are those that, given their degree of complexity, require an ongoing research effort and a sound technological base. The activities included in this sector, according to the CNAE 2009, are listed on the Eustat website. Methodology file: The high technology statistics sector
For further information:
Eustat - Euskal Estatistika Erakundea / Basque Statistics Institute
C/ Donostia-San Sebastián, 1 01010 Vitoria-Gasteiz
Press service: servicioprensa@eustat.es Tel.: 945 01 75 62