Press Release 17/12/2025
STATISTICS FOR BIOTECHNOLOGY R&D. 2024
Spending on R&D in biotechnology increased by 4.9 % in 2024, reaching 193.7 million euros
Human health research took up three quarters of expenditure on biotechnology
In 2024, expenditure on internal R&D for activities related to biotechnology increased to 193.7 million euros in the Basque Country, 4.9% higher than in 2023, according to Eustat data. This figure represents an increase of 9 million euros, and maintains the upward trend since 2007, the first year available, when it was 80.8 million.
Expenditure on biotechnology R&D accounted for 9.2% of total internal R&D expenditure, the same as in 2023. In the last decade, this share has been rising steadily: 6.7% in 2015; 7.9% in 2018; and 8.5% in 2020.
The numbers of personnel employed reached 2056 people at Full-Time Equivalent (FTE), an increase of 1.2% compared with the previous year, and representing 8.4% of the total personnel in FTE dedicated to R&D. Research staff reached 1,499.1 people in FTE, 2.6% more than the previous year.
In 2024, women represented 60.7% of full time personnel in biotechnology, a slight increase compared with the 60.2% recorded in 2023.
Evolution of expenditure and personnel (EFT) in internal R&D in biotechnology within the Basque Country. 2014-2024
| |
2014 |
2015 |
2016 |
2017 |
2018 |
2019 |
2020 |
2021 |
2022 |
2023 |
2024 |
| Internal R&D |
|
|
|
|
|
|
|
|
|
|
|
| Total (thousands of euros) |
86,677 |
85,691 |
84,690 |
93,221 |
112,534 |
123,354 |
126,610 |
142,198 |
156,183 |
184,713 |
193,673 |
| Annual increase (%) |
-5.8 |
-1.1 |
-1.2 |
10.1 |
20.7 |
9.6 |
2.6 |
12.3 |
9.8 |
18.3 |
4.9 |
| Personnel (F.T.E.) |
|
|
|
|
|
|
|
|
|
|
|
| Total |
1,183.7 |
1,255.5 |
1,234.8 |
1,345.5 |
1,442.1 |
1,472.7 |
1,521.5 |
1,666.5 |
1,739.5 |
2,032.1 |
2,056.3 |
| Annual increase (%) |
0.1 |
6.1 |
-1.6 |
9.0 |
7.2 |
2.1 |
3.3 |
9.5 |
4.4 |
16.8 |
1.2 |
| Research personnel (FTE) |
|
|
|
|
|
|
|
|
|
|
|
| Total |
909.3 |
977.0 |
964.5 |
1,031.0 |
1,087.7 |
1,106.7 |
1,141.0 |
1,244.9 |
1,270.5 |
1,461.3 |
1,499.1 |
| Annual increase (%) |
0.7 |
7.4 |
-1.3 |
6.9 |
5.5 |
1.7 |
3.1 |
9.1 |
2.1 |
15.0 |
2.6 |
F.T.E.= full time equivalent
Date December 17, 2025
Source: Eustat. Statistics for R&D in biotechnology
A total of 108 entities carried out research activities in biotechnology. Moreover, 71 of these 108 entities dedicated 100% of their internal R&D expenditure to biotechnology.
Of the entities identified, 101 belong to the business sector, which has experienced a sustained rise in the last 18 years in the field of research in biotechnology, given that in 2007 only 43 entities were recorded.
67.8% of expenditure on internal biotechnology R&D came from the Business and Private NPI sector
The Business and Private Non-Profit Institutions (NPI) sector accounted for 67.8% of total expenditure on internal R&D in biotechnology, a slightly lower figure than in 2023 (68.9%) and 2022 (69.3%). Businesses and Private NPIs absorbed 131.2 million euros, while the sectors of Higher Education and Public Administration jointly spent 63.5 million (24.2% and 8.0% respectively).
Public administration financed 50.4% of internal biotechnology R&D
According to the origin of the funds, internal R&D activities relating to biotechnology in 2024 were mainly financed with funds from the Public Administration, 50.4%, and Businesses, 36.1%. The rest was funded through funds from abroad (8.8%) Private non-profit institutions (3.3%) and from higher education (1.4%).
As regards the areas of application of biotechnology research, of particular note was ‘Human Health’, with 77.5% of total expenditure. Other areas, such as ‘Animal health and aquaculture’ and ‘Food’ - 7.3% and 5.7% respectively - ‘Environment’, ‘Agriculture and forestry’, and ‘Industry’ - 9.5% between all three of them - complete the total.
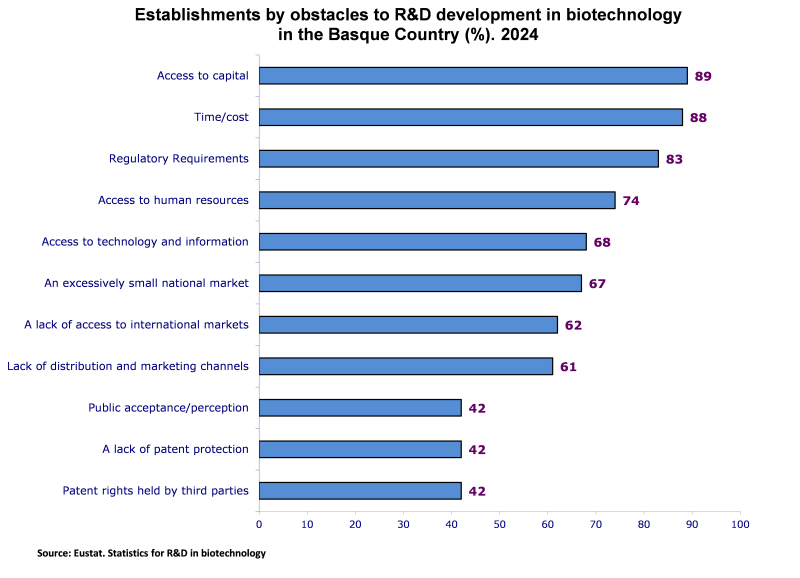
Access to capital and time/cost stood out as the main obstacles for carrying out internal R&D activities in biotechnology
The main obstacle indicated by businesses to developing internal R&D in biotechnology is access to capital, mentioned by 89%, followed very closely by time and cost, which reached 88%. In third place were regulatory requirements, with 83%. Other factors that also stand out are access to human resources, identified by 74%, access to technology and information, with 68%, and the reduced size of the national market, which reached 67%. In the middle were lack of access to international markets, with 62%, and lack of distribution and sales channels, with 61%. Finally, the lowest percentages correspond to acceptance or public opinion, lack of protection for patents and patent rights in the hands of others, with 42% each.
NOTES
Eustat would like to thank all the companies and institutions that have collaborated in preparing this survey, the information for which was gathered between April and October 2025, for their efforts. Without their collaboration it would not have been possible.
For further information:
Eustat - Euskal Estatistika Erakundea/Basque Statistics Institute
C/ Donostia-San Sebastián, 1 01010 Vitoria-Gasteiz
Press Service: servicioprensa@eustat.es Tel.: 945 01 75 62