Press release 19/12/2025
DIRECTORY OF PUBLIC ADMINISTRATIONS. 01/01/2025
The Public Administrations employed 163,196 people as at 1 January 2025, 0.2% fewer than the previous year
The number of civil servants in the Basque administrations increased by 7.9%, accounting for 69.8% of all staff
As at 1 January 2025, the Public Administrations of the Basque Country employed 163,196 people, representing a drop of 0.2% compared to the previous year, according to Eustat data. For the first time, these data include information on personnel working in the State Administration of the Basque Country.
The ratio of women to men in public employment has remained unchanged since 2024, with women accounting for 62% (101,161) and men 38% (62,035). Looking at the period 2020-2025, the proportion of women in the Basque Administrations rose by 8.5%, while in State-dependent entities it fell by 1%.
Staff employed in Basque public administrations on 1 January by sex. 2020-2025
| |
2020 |
2021 |
2022 |
2023 |
2024 |
2025 |
| |
Num. |
% |
Num. |
% |
Num. |
% |
Num. |
% |
Num. |
% |
Num. |
% |
| Total |
155,586 |
100.0 |
158,036 |
100.0 |
161,972 |
100.0 |
161,269 |
100.0 |
163,507 |
100.0 |
163,196 |
100.0 |
| Women |
61,674 |
39.6 |
61,542 |
38.9 |
62,494 |
38.6 |
61,928 |
38.4 |
62,124 |
38.0 |
62,035 |
38.0 |
| Men |
93,912 |
60.4 |
96,494 |
61.1 |
99,478 |
61.4 |
99,341 |
61.6 |
101,383 |
62.0 |
101,161 |
62.0 |
Date December 19, 2025
Source: Eustat. Directory of public administrations
The feminisation rate exceeded 50% in all administrative areas, most notably the Basque Administrations (64.2%). In contrast, entities dependent on the Central Administration recorded a much lower rate of 38.8%. The Basque Government had the highest proportion of women, with 70.2%, followed by the Provincial Councils (60.2%). Local Entities saw a near-equal gender split, with 50.3% women and 49.7% men.
Staff structure according to the regulatory framework
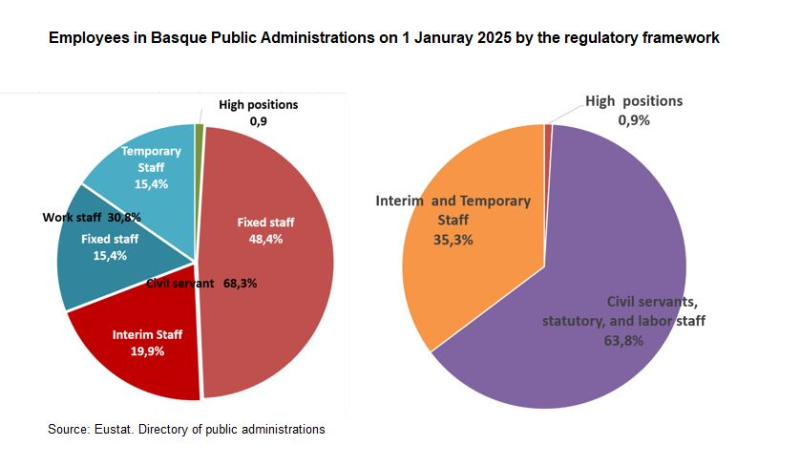
Civil servants made up 68.3% of the total number of people employed in the Basque Country at the beginning of 2025, representing an increase of 4.6 percentage points compared to the previous year, due to a year-on-year rise of 7.1%. Meanwhile, contractual employees accounted for 30.8%, with both figures including statutory personnel of the Osakidetza (the Basque Health Service). The remaining 0.9% corresponded to senior posts.
As regards job stability, 63.8% of public sector staff held permanent positions, including civil servants, contractual employees and permanent statutory personnel. This proportion stood at 61.1% in the Basque Administrations and rose to 91.5% in entities dependent on the Central Administration.
Employeesd in Basque Public Administrations by the regulatory framework. 01/01/2025
| |
TOTAL PUBLIC ADMINISTRATION |
Total Basque Administration |
Basque Government and dependent organisms |
Provincial Councilst and dependent organisms |
Local authorities and dependent organisms |
Other Basque local public bodies |
TOTAL Central Administration |
| Total |
163,196 |
148,810 |
96,605 |
12,879 |
28,378 |
10,948 |
14,386 |
| High positions |
1,504 |
1,456 |
331 |
217 |
728 |
180 |
48 |
| Total civil servants |
111,413 |
103,881 |
75,756 |
8,104 |
17,028 |
2,993 |
7,532 |
| Permanent Civil Servants |
78,933 |
71,572 |
54,271 |
5,028 |
10,222 |
2,051 |
7,361 |
| Substitute Public Servants |
32,480 |
32,309 |
21,485 |
3,076 |
6,806 |
942 |
171 |
| Total workers |
50,279 |
43,473 |
20,518 |
4,558 |
10,622 |
7,775 |
6,806 |
| Permanent Workers |
25,215 |
19,418 |
7,038 |
2,695 |
6,012 |
3,673 |
5,797 |
| Temporary Workers |
25,064 |
24,055 |
13,480 |
1,863 |
4,610 |
4,102 |
1,009 |
Date December 19, 2025
Source: Eustat. Directory of public administrations
Interim civil servants represented 19.9% of the total, following an increase of 6.6% compared to the previous year, with notable growth in the Basque Administrations (+7%), especially the Basque Government and its dependent bodies (+17.8%). Local Entities and dependent bodies and other Basque entities also posted increases (4.7%), while the Provincial Councils and their bodies recorded a decrease of 8.7%. In the State Administration, the drop was even more pronounced, at 35.5%.
The proportion of temporary staff continued to decline, with a fall of five percentage points, equivalent to a decrease of 25.2% in respect of the previous year. The Basque Government and its bodies saw the sharpest drop (-35.7%), followed by Local Entities and their bodies (-12.1%) and the remaining other Basque entities (-1.6%). The Provincial Councils and their dependent bodies registered a slight increase (1%), while the state public bodies posted a decrease of 22.5%.
As a whole, interim civil servants and temporary staff accounted for 35.3% of the total, representing a drop of 10.1%.
Distribution of personnel by type of administration
Of the total number of public sector employees as at 1 January 2025, 91.2% worked for the Basque Administrations and 8.8% for entities dependent on the Central Administration. Within the Basque Administrations, the majority were concentrated in the General Administration of the Basque Country (59.2%), followed by Local Entities (17.4%), the Provincial Councils (7.9%) and the University, Foundations and other Basque public bodies (6.7%).
In terms of annual growth, Local Entities and their dependent bodies recorded the highest increase in staff numbers (2.1%), followed by the Provincial Councils and their dependent bodies (1.7%) and other Basque public bodies (0.5%). In contrast, the Basque Government and its bodies registered a decline of 1.2%, while the State Administration saw a decrease of 0.1%.
In terms of the average annual number of staff, since 2019, public sector employment across all the Public Administrations has risen by 9,437 people, with an average annual cumulative rate of 1%. Of particular note was the increase recorded in the Basque Administrations, with 10,780 more employees in the same period, compared to the decline seen in state bodies, with 1,343 fewer employees and an average cumulative rate of -1.5%. The Basque Government and its dependent bodies registered the highest absolute growth (+7,616), with an average cumulative variation of 1.4%, followed by Local Entities (+1,641), with an average cumulative variation rate of 1%, the Provincial Councils (+1,143), with a rate of 1.5%, and the University, Foundations and Public Associations as a whole (+380), with an average cumulative rate of 0.6%.
Over the past year, the average number of staff working in the Public Administrations rose by 0.7%, with the most significant increase recorded in Local Entities and dependent bodies (2.5%).
Personnel means employed in the Basque public administration by type of entity. 2019-2024


| |
2019 |
2020 |
2021 |
2022 |
2023 |
2024 |
2024 / 2023 |
TMAA 2024 / 2019 (%) |
| |
Num. |
% |
Num. |
% |
Num. |
% |
Num. |
% |
Num. |
% |
Num. |
% |
|
|
| TOTAL PUBLIC ADMINISTRATION |
153,046 |
100.0 |
155,758 |
100.0 |
159,349 |
100.0 |
159,773 |
100.0 |
161,339 |
100.0 |
162,483 |
100.0 |
0.7 |
1.0 |
| Total Basque Administration |
137,373 |
89.8 |
140,411 |
90.1 |
144,068 |
90.4 |
145,629 |
91.1 |
147,205 |
91.2 |
148,153 |
91.2 |
0.6 |
1.3 |
| Basque Government and dependent organisms |
88,457 |
64.4 |
91,230 |
65.0 |
94,077 |
65.3 |
95,424 |
65.5 |
96,296 |
65.4 |
96,073 |
65.4 |
-0.2 |
1.4 |
| Provincial Councilst and dependent organisms |
11,836 |
8.6 |
12,080 |
8.6 |
12,319 |
8.6 |
12,221 |
8.4 |
12,730 |
8.6 |
12,979 |
8.6 |
2.0 |
1.5 |
| Local authorities and dependent organisms |
26,504 |
19.3 |
26,325 |
18.7 |
26,598 |
18.5 |
26,913 |
18.5 |
27,456 |
18.7 |
28,145 |
18.7 |
2.5 |
1.0 |
| Other Basque local public bodies |
10,576 |
7.7 |
10,778 |
7.7 |
11,074 |
7.7 |
11,071 |
7.6 |
10,723 |
7.3 |
10,956 |
7.3 |
2.2 |
0.6 |
| TOTAL Central Administration |
15,673 |
10.2 |
15,347 |
9.9 |
15,281 |
9.6 |
14,144 |
8.9 |
14,134 |
8.8 |
14,330 |
8.8 |
1.4 |
-1.5 |
CMRC: cumulative mean rate of change
Date December 19, 2025
Source: Eustat. Directory of public administrations
Distribution of personnel by province
With regard to the weight of each type of public administration by province, Álava had a higher proportion of staff employed by the Basque Administrations (92.4%) compared to 7.6% employed by the State Administration. Bizkaia and Gipuzkoa saw similar percentages, with 90.8% of public sector staff belonging to the Basque Administration compared to 9.2% belonging to the State Administration.
Meanwhile, the province of Bizkaia accounted for 49.1% of the total number of people employed by the Public Administration, followed by Gipuzkoa, with 29.5%, and, lastly, Álava, with the remaining 21.4%.
Territorial distribution of personnel employed in the Basque public administration . 01/01/2025
| |
Total |
Araba/Álava |
Bizkaia |
Gipuzkoa |
| Total public administration |
163,196 |
35,085 |
79,795 |
48,316 |
| Total Basque Administration |
148,810 |
32,462 |
72,456 |
43,892 |
| Basque Government and dependent organisms |
96,605 |
21,269 |
47,465 |
27,871 |
| Provincial Councilst and dependent organisms |
12,879 |
4,144 |
5,783 |
2,952 |
| Local authorities and dependent organisms |
28,378 |
5,139 |
13,511 |
9,728 |
| Other Basque local public bodies |
10,948 |
1,910 |
5,697 |
3,341 |
| TOTAL Central Administration |
14,386 |
2,623 |
7,339 |
4,424 |
Date December 19, 2025
Source: Eustat. Directory of public administrations
Methodological note
The Directory of Public Administrations comprises the General Administration of the Basque Country, Provincial Councils and City Councils, together with the Autonomous Administrative Bodies, Public Entities, Public Companies, Foundations and dependent non-profit Institutions, as well as Public Bodies dependent on the State Administration. All entities whose public stake is equal to or greater than 50% are included, whether that stake be held by a single administration or jointly by various public administrations.
For further information:
Eustat - Euskal Estatistika Erakundea/Basque Statistics Institute
C/ Donostia-San Sebastián, 1 01010 Vitoria-Gasteiz
Press Service: servicioprensa@eustat.eus Tel.: 945 01 75 62