Press release 26/12/2025
Tourism expenditure in the Basque Country rose by 8.6%, amounting to 6,665 million euros
Tourism expenditure has grown by 31.1% over the past 5 years, representing 6.8% of GDP in 2024, compared with 6.3% in 2019
Tourism expenditure in the Basque Country amounted to 6,665 million euros in 2024, 526 million higher than the previous year, according to data produced by Eustat. This represents an increase of 8.6% compared with 2023, and is 31.1% up on 2019, the year prior to the pandemic. The rise in expenditure is, however, lower than in the three previous years, the period of recovery after the health crisis.
Tourism strengthens its role in the Basque economy, contributing 6.8% of Gross Domestic Product (GDP) at market prices in 2024, compared with 6.6% in 2023 and 6.3% in 2019.
Both aggregates that make up tourism expenditure rose in 2024. Incoming Tourism, which includes tourism expenditure in the Basque Country by those from abroad and elsewhere in Spain, grew by 7.0%. In terms of its proportion out of overall tourism expenditure, this accounted for 60.6% of the total, equivalent to 4.1% of GDP.
Meanwhile, the Other components of tourism, comprising expenditure by Basque residents within the autonomous region itself, expenditure by public authorities on tourism programmes, and investment in the specific branches of tourism, registered an increase of 11.1% in 2024. These other components accounted for 39.4% of overall tourism expenditure, making up 2.7% of the GDP of the Basque Country.
Contribution of tourism to the economy of the Basque Country. Thousands euros and percentage on GDP p.m. Current prices. 2019-2024


| |
2019 |
2020 |
2021 |
2022 |
2023 |
2024(a) |
Annual variation rate (%) |
| |
|
|
|
|
|
|
2024(a)/2023 |
2023/2022 |
2024(a)/2019 |
| Total Tourist Spending |
5,084,280 |
2,721,823 |
3,173,090 |
4,738,176 |
6,139,404 |
6,664,880 |
8.6 |
29.6 |
31.1 |
| Incoming tourism |
3,036,341 |
1,202,793 |
1,514,301 |
2,861,716 |
3,778,296 |
4,041,174 |
7.0 |
32.0 |
33.1 |
| Other components of tourism |
2,047,939 |
1,519,030 |
1,658,789 |
1,876,460 |
2,361,108 |
2,623,706 |
11.1 |
25.8 |
28.1 |
| |
| Total tourist Spending (%) |
100.0 |
100.0 |
100.0 |
100.0 |
100.0 |
100.0 |
* |
* |
* |
| Incoming tourism |
59.7 |
44.2 |
47.7 |
60.4 |
61.5 |
60.6 |
-0.9 |
1.1 |
0.9 |
| Other components of tourism |
40.3 |
55.8 |
52.3 |
39.6 |
38.5 |
39.4 |
0.9 |
-1.1 |
-0.9 |
| |
| Percentage on the GDP p.m |
|
|
|
|
|
|
* |
* |
* |
| Total Tourist Spending |
6.3 |
3.8 |
4.0 |
5.5 |
6.6 |
6.8 |
0.2 |
1.1 |
0.5 |
| Incoming tourism |
3.8 |
1.7 |
1.9 |
3.3 |
4.1 |
4.1 |
0.0 |
0.8 |
0.3 |
| Other components of tourism |
2.5 |
2.1 |
2.1 |
2.2 |
2.5 |
2.7 |
0.2 |
0.3 |
0.2 |
Base 2022
(a)Advanced data
(*)Difference in percentage points
Date December 26, 2025
Source: Eustat. Tourism satellite account
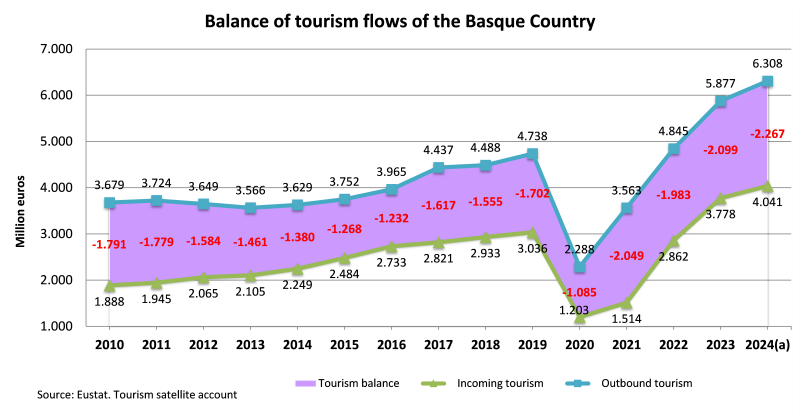
Outgoing tourism proved more dynamic than incoming tourism in 2024
In 2024, both Outgoing Tourism and Incoming Tourism in the Autonomous Region of the Basque Country maintained the upward trend in constant expenditure seen since 2021. A slight slackening of the pace of growth may nonetheless be noted with regard to previous years, which had seen very high growth rates because of the resumption of normal activity following the crisis resulting from the pandemic.
Outgoing Tourism, which refers to expenditure by Basque residents outside the Basque Country, amounted to 6,308 million euros, revealing slightly more dynamic behaviour than Incoming Tourism. During 2024, the figure rose by 431 million euros, an increase of 7.3% compared with 2023.
Meanwhile, Incoming Tourism, which covers tourism expenditure in the Basque Country by foreign visitors and those from elsewhere in Spain, amounted to 4,041 million euros in 2024. This represented an increase of 263 million euros compared with 2023, in other words 7.0% higher.
As a result of the evolution of both components, the Tourism Balance of the Basque Country reflected a growing deficit. The deficit thus rose from 2,099 million euros in 2023, to a figure of 2,267 million in 2024.
Gipuzkoa and Álava lead the growth in tourism expenditure in 2024, with a higher figure than the average for the Basque Country
The analysis of tourism expenditure by province reveals that Gipuzkoa and Álava registered increases in excess of the average for the autonomous region (8.6%). Gipuzkoa saw growth of 9.3% in tourism expenditure, while the figure for Álava amounted to 9.2%. Meanwhile, Bizkaia registered a more moderate rise of 7.6%. As with the overall rate of growth for the Basque Country, these figures are lower than those seen in previous years, but higher than before the pandemic.
As for the proportion that each province represents out of overall tourism expenditure in the Basque Country in 2024, Bizkaia accounted for 43.4%, a slight drop of four tenths of a percentage point compared with 2023. For its part, Gipuzkoa contributed 42.7% of the total, increasing its share by three tenths compared with the previous year. Álava made up 13.9%, one tenth higher than in 2023.
Taking into account tourism expenditure as a proportion of GDP in each province, we likewise see an increase since 2023. In Gipuzkoa, tourism expenditure accounted for 8.7% of GDP in 2024, higher than the figure of 8.4% the previous year. In Álava, this indicator represented 5.9% of GDP, compared with 5.7% in 2023. In Bizkaia, tourism expenditure amounted to 5.8% of GDP, one tenth higher than the previous year.
Contribution of tourism to the economy of the Basque Country by province. Thousands euros and percentage on GDP p.m. Current prices. 2019-2024
| |
2019 |
2020 |
2021 |
2022 |
2023 |
2024(a) |
Annual variation rate (%) |
| |
|
|
|
|
|
|
2024(a)/2023 |
2023/2022 |
2024(a)/2019 |
| Total Tourist Spending |
|
|
|
|
|
|
|
|
|
| Basque Country |
5,084,280 |
2,721,823 |
3,173,090 |
4,738,176 |
6,139,404 |
6,664,880 |
8.6 |
29.6 |
31.1 |
| Araba/Álava |
676,772 |
399,461 |
475,259 |
651,322 |
850,595 |
928,553 |
9.2 |
30.6 |
37.2 |
| Bizkaia |
2,263,742 |
1,163,321 |
1,322,991 |
2,070,274 |
2,687,435 |
2,892,557 |
7.6 |
29.8 |
27.8 |
| Gipuzkoa |
2,143,766 |
1,159,041 |
1,374,840 |
2,016,580 |
2,601,374 |
2,843,770 |
9.3 |
29.0 |
32.7 |
| |
| Total tourist Spending (%) |
|
|
|
|
|
|
|
|
|
| Basque Country |
100.0 |
100.0 |
100.0 |
100.0 |
100.0 |
100.0 |
* |
* |
* |
| Araba/Álava |
13.3 |
14.7 |
15.0 |
13.7 |
13.8 |
13.9 |
0.1 |
0.1 |
0.6 |
| Bizkaia |
44.5 |
42.7 |
41.7 |
43.7 |
43.8 |
43.4 |
-0.4 |
0.1 |
-1.1 |
| Gipuzkoa |
42.2 |
42.6 |
43.3 |
42.6 |
42.4 |
42.7 |
0.3 |
-0.2 |
0.5 |
| |
| Percentage on the GDP p.m |
|
|
|
|
|
|
* |
* |
* |
| Basque Country |
6.3 |
3.8 |
4.0 |
5.5 |
6.6 |
6.8 |
0.2 |
1.1 |
0.5 |
| Araba/Álava |
5.1 |
3.4 |
3.7 |
4.7 |
5.7 |
5.9 |
0.2 |
1.0 |
0.8 |
| Bizkaia |
5.7 |
3.2 |
3.4 |
4.7 |
5.7 |
5.8 |
0.1 |
1.0 |
0.1 |
| Gipuzkoa |
7.8 |
4.7 |
5.2 |
7.0 |
8.4 |
8.7 |
0.3 |
1.4 |
0.9 |
Base 2022
(a)Advanced data
(*)Difference in percentage points
Date December 26, 2025
Source: Eustat. Tourism satellite account
Note:
The Tourism Satellite Account is drawn up in accordance with the methodology approved by the United Nations Statistical Commission and supported by the World Tourism Organization (UN Tourism), EUROSTAT and the OECD. It comprises a set of accounts and tables presenting the different interrelated parameters of tourism on both the supply and demand side, in accordance with the National Accounting principles.
For further information:
Eustat - Euskal Estatistika Erakundea/Basque Statistics Institute
C/ Donostia-San Sebastián, 1 01010 Vitoria-Gasteiz
Press Service: servicioprensa@eustat.eus Tel.: 945 01 75 62