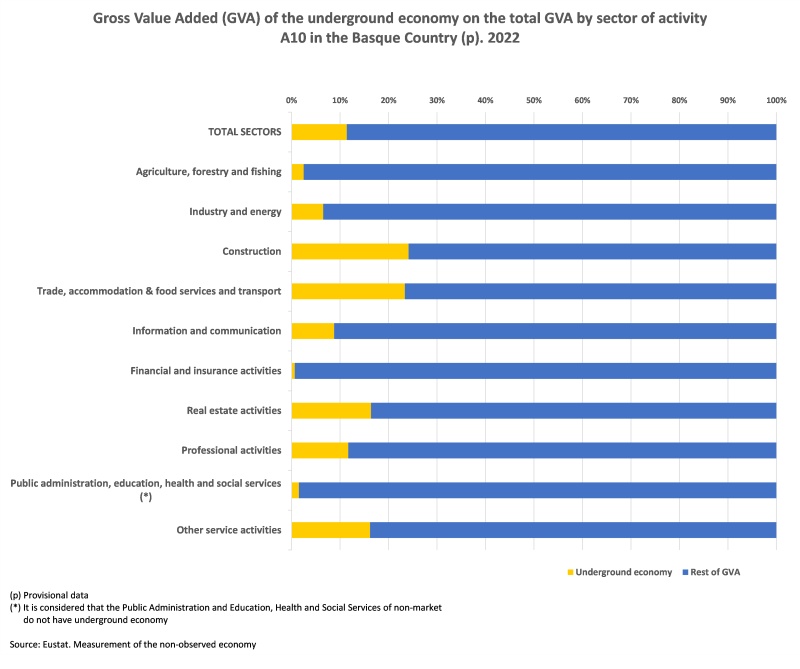
It was estimated that the underground economy in the Basque Country represented 10.7% of GDP in 2022
Trade, Hospitality and Transport and Construction were the sectors with the highest percentages of underground value added
The Gross Value Added (GVA) generated by the underground economy was valued at 9,318 million euros in the Basque Country in 2022, equivalent to 10.7% of GDP for that year, according to Eustat estimates. Compared to 2020, it represents a nominal increase of 1,803 million and 4 tenths in terms of GDP, going from 10.3% in 2020 to 10.7% in 2022. It should be noted that the 2020 data have been revised due to the change of base (2022 base) carried out in the Economic Accounts system, following the extraordinary revision policies established by Eurostat.
Underground activities are those activities that are productive and legal but deliberately concealed (partially or fully) from the public authorities, usually to avoid paying taxes or social security contributions. This data, included in the accounts system prepared by Eustat in their Annual Economic Accounts, has been prepared according to Eurostat's methodology and the System of National Accounts (United Nations, 2008). Underground activities are one of the areas that form part of the Non-Observed Economy (NOE), together with illegal activities, informal production and production by households for their own final use.
By sector, the largest estimated underground economy was in the Trade (including vehicle repair), Hospitality and Transport sector, where it accounted for 25% of its activity in 2022. It was followed by Construction, whose underground activity contributed 23.5% of the total GVA generated by the sector, and Property Activities, whose underground activity contributed 16.6%.
For Arts, Recreation and Entertainment Activities, it was approximated that 14.8% of its wealth was generated covertly, while for Other Professional Activities and Auxiliary Services, the percentage was estimated at 10.9% of the sector.
In the other sectors, underground activities made a far more moderate contribution. In the Information and Communications sector, the estimated percentage was 7%, and in Industry it was 6.3%. In the Primary sector, this represented 3%, and in the Education, Health and Market Social Services sectors, it was estimated at 1.6%.
In relation to the total value of the underground economy, the Services sector made the greatest contribution, absorbing 75%. Of particular note within the Services sector was Trade, Hospitality and Transport, with 44.5%, and in second place, albeit at some distance, was Property Activities, with 13.6%. Professional Activities accounted for 9.1% of the total value of underground activities, and Other Services Activities (which include recreational and cultural services, repair of computers and other articles, as well as activities related to washing and cleaning services, hairdressing and other beauty treatments) represented 4.8%.
Private sector activities related to Education, Health and Social Services (2.3%), the Information and Communications sector (1.6%) and Financial and Insurance Activities (0.3%) completed the total for the sector.
Period availables
With regard to the other major sectors, of particular note was Industry and Energy, with 12.8%, followed by Construction, which accounted for 10.8% of the total underground economy. Finally, standing below 1% was the Primary sector, with 0.2%.
Methodological note:
The data for 2020 have been recalculated due to the change of base year (base year 2022) in the system of Economic Accounts following the European extraordinary revision policy established by Eurostat, marking this milestone for all the National Accounts disseminations scheduled for 2024. This revision involves recalculating the data for the entire series of years published, in this case 2020.
The Methodology of the European System of Accounts (ESA 2010) states that the measurement of GDP should include the “observed economy” (OE), which is the production space directly reported by statistics through economic censuses and/or annual surveys, and the “non-observed economy” (NOE), which is the production space that is not directly captured by traditional economic statistical sources such as those described above, and which in practical terms will require adjustments to be made.
Following the tabular approach defined by Eurostat, the Non-Observed Economy distinguishes seven components (N1 to N7), which can be broadly classified into four categories referring to:
a) Unregistered producers:
N1 – Producers deliberately not registering – Underground activities
N2 – Producers deliberately not registering – Illegal activities
N3 – Producers not required to register – Informal activities and Self-consumption
b) Producers not surveyed:
N4 – Legal persons not surveyed – Deficiencies in data collection
N5 – Registered entrepreneurs not surveyed – Deficiencies in data collection
c) Misreporting:
N6 – Producers deliberately misreporting – Deficiencies in data collection and Underground activities
d) Other deficiencies:
N7 – Other statistical deficiencies
Today, Eustat is publishing data on what is known as the “underground economy”, which covers categories N1 and N6 of Eurostat’s tabular approach and is defined by the European Commission as those activities that are productive in an economic sense, and relatively legal (depending on local standards and regulations), but deliberately concealed from the public authorities.
For further information:
Eustat - Euskal Estatistika Erakundea/Basque Statistics Institute
C/ Donostia-San Sebastián, 1 01010 Vitoria-Gasteiz
Press Service: servicioprensa@eustat.eus Tel.: 945 01 75 62