Press release 15/10/2025
EQUITY ACCOUNTS OF NON-FINANCIAL COMPANIES. 2023
The economic profitability of non-financial companies was 6.5% and financial profitability stood at 10.4%.
The debt of non-financial companies in the Basque Country fell by more than one percentage point to stand at 46.7% in 2023
In the Basque Country, the economic profitability of non-financial companies was 6.5% in 2023, while financial profitability stood at 10.4%, according to data prepared by Eustat.
The total debt ratio of non-financial sector companies in the Autonomous Community of Euskadi stood at 46.7% in 2023. This indicator establishes the ratio of external resources to total assets, allowing the financial risk of companies to be assessed, and indicated that less than half of assets were financed by external resources. Its value was 1.1 percentage points lower than that registered in 2022.
In terms of distribution by company size, medium-sized companies (50 to 249 employees) had the highest total debt ratio, with 51.1%, followed by large companies (more than 249 employees), with 49.5%, which was very close to the 49.4% recorded by small companies (10 to 49 employees). Micro-enterprises (1 to 9 employees) had the lowest ratio, with 40.7%.
There were significant variations by activity sector. The sectors with the highest total debt ratios (above 60%) were: Manufacture of transport material (73.4%), Telecommunications (69.8%) and Hospitality (63.1%). In contrast, the sectors with the lowest ratios (below 30%), included Water supply; sewerage, waste management and remediation activities (27.3%) and Property activities (24.6%).
In 2023, current assets of non-financial companies decreased by 0.4%, while total assets were down 3.2%
In 2023, the cumulative equity value of non-financial Basque companies stood at 226,787 million euros in nominal terms. The equity value includes all the assets and rights that a company has, as well as the debts or obligations it owes.
Looking at the main economic sectors, services accounted for 50.6% of the total assets of non-financial companies, while industry represented 41.6% and construction the remaining 7.8%. If we compare this structure with that of 2010, we can see that services gained ground (44.1% in 2010), as did industry, albeit to a lesser extent (40.5% in 2010), to the detriment of the construction sector (15.4% in 2010).
Fixed or non-current assets include long-term resources for the business, such as intangible (patents, trademarks) and tangible fixed assets (machinery, buildings), and investments in real estate and group companies or long-term financial investments. They were the most significant item in quantitative terms, and in 2023, amounted to 127,127 million euros, representing 56.1% of total assets.
Current assets (company assets that can be converted into cash in less than twelve months) accounted for the remaining 43.9%, with 99,659 million euros.
With this trend, fixed assets decreased by 5.2% compared to 2022, while current or floating assets were down 0.4%. As a combination of both, total assets fell by 3.2% in relation to the previous year.
It is worth noting that the ratio of fixed assets to current assets varied substantially depending on the specific sector of activity, ranging from 27.5% in the activity branch dedicated to the Textile, garments, leather and footwear industries to 88.5% in Electricity, gas, steam and air conditioning supply. In addition to the latter, with ratios over 70%, were Telecommunications (84.5%) and Property activities (76.8%). At the other end of the scale, with ratios between 30% and 40%, were: Manufacture of machinery and equipment n.e.c.; Construction; Manufacture of furniture; other manufacturing industries; repair and installation of machinery and equipment; Manufacture of rubber and plastic products and other non-metallic mineral products; Manufacture of electrical material and equipment and Wholesale and retail trade; repair of motor vehicles and motorcycles.
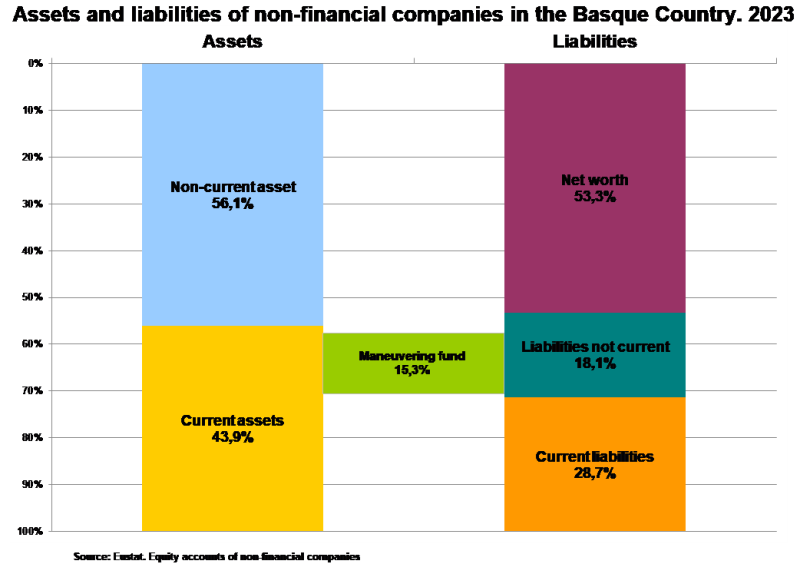
In turn, within liabilities and net equity as a whole, the share of net equity reached a total of 120,788 million euros and represented 53.3% in 2023, 1.1% lower than the figure recorded in 2022. Liabilities represent a company's financial obligations, while net equity (or own resources) is the total amount of financial resources available.
Short-term debts or current liabilities as a whole, with a total value of 64,993 million euros, amounted to 28.7%, registering a negative variation of 5% in the past year.
Long-term debts or non-current liabilities, standing at 41,006 million, fell by 6% in the past year, accounting for 18.1% as a whole. Non-current liabilities consist of long-term debts and obligations, i.e. those with a maturity of more than one year.
With these results, working capital, a company’s capacity to meet its short-term debts, which is calculated as the difference between current assets and current liabilities, was positive and stood at 34,666 million euros (15.3% of total assets), 9.6% higher than in 2022.
The economic and financial profitability of non-financial Basque companies was the highest since 2010
The economic profitability of non-financial companies was 6.5% in 2023, while financial profitability stood at 10.4%, the best results since 2010. These figures represent nearly one percentage point more than those obtained in 2022 in both cases.
Economic profitability measures the efficiency in the use of business resources, indicating the ability of assets to generate results. A higher value reflects greater productivity of invested capital, requiring fewer assets to achieve the same profit..
In the financial year analysed, large companies (more than 249 employees) recorded the highest economic profitability, with 8.6%, following a year-on-year increase of 1.1 percentage points compared to 2022. This result represents the highest value in the available historical series.
Small companies (with 10 to 49 employees) also performed positively, with a profitability of 6.2% in 2023. Micro-enterprises (1 to 9 employees) and medium-sized companies (50 to 249 employees) posted similar positive results, both with 5.7%.
From a sectoral perspective, all activity sectors had a positive economic profitability in 2023. Of particular note were Electricity, gas, steam and air conditioning supply (13.6%), Manufacture of rubber and plastic products and other non-metallic mineral products (11.3%) and Chemical industry (10.6%). At the other end of the scale were Research and development activities (0.7%) and Arts, recreation and entertainment activities (2%), which have traditionally had the lowest levels of profitability.
As regards the year-on-year evolution, there were significant improvements in Electricity, gas, steam and air conditioning supply, Extraction industries and Other services, with increases of 6.5, 4.6 and 4.4 percentage points (p.p.), respectively, reaching levels of 13.6%, 8.4% and 6.9%.
Meanwhile, financial profitability (the indicator that measures a company’s ability to pay its owners or shareholders with the profits obtained) stood at 10.4% in 2023, after increasing by 0.9 percentage points compared to the previous financial year.
When considering company size, the pattern was similar to that of economic profitability: large companies achieved a profitability of 14.7%, followed by small companies (10.1%), medium-sized companies (9.4%) and micro-enterprises (8.4%). In terms of variation, micro-enterprises saw the greatest increase (+1.7 p.p.), followed by large (+0.8 p.p.) and medium-sized companies (+0.6 p.p.), while small companies registered a slight decrease (–0.3 p.p.).
The sector-level analysis of financial profitability revealed a wide spread of results. Four activity branches exceeded 15%. At the top of this list was Electricity, gas, steam and air conditioning supply (21.8%), followed by Manufacture of rubber and plastic products and other non-metallic mineral products (19.9%), Chemical industry (16.8%) and Manufacture of transport material (15.1%).
A second group, comprising eight sectors of varying nature, had a financial profitability that equalled or exceeded the average of 10%. Of particular note within this group were Wholesale and retail trade; repair of motor vehicles and motorcycles, Hospitality and Other services, with 14.6%, together with Healthcare activities in the market, Manufacture of pharmaceutical products, Manufacture of electrical material and equipment, Extraction industries, Timber, paper and graphic arts, Manufacture of machinery and equipment n.e.c., Manufacture of furniture; other manufacturing industries; repair and installation of machinery and equipment, Manufacture of base metals and metal products, excluding machinery and equipment, and Manufacture of computer, electronic and optical products, with profitability between 13.3% and 10.1%.
The remaining activities registered below-average, but positive, profitability, with the sole exception of the Telecommunications sector, which recorded negative financial profitability (-2.8%).
For further information:
Eustat - Euskal Estatistika Erakundea / Basque Statistics Institute
C/ Donostia-San Sebastián, 1 01010 Vitoria-Gasteiz
Press Service: servicioprensa@eustat.eus Tel.: 945 01 75 62