Press release 19/12/2024
ENVIRONMENTAL ACCOUNTS: ENVIRONMENTAL GOODS AND SERVICES ACCOUNT, 2022
The gross value added generated by the environmental economy in the Basque Country grew by 8.2% in 2022
In terms of employment, the environmental economy created 27,740 jobs, 2.9% of the total for the economy
According to Eustat data, in 2022 the environmental economy in the Basque Country generated gross value added (GVA) of 2,176 million euros, representing 2.51% of the region’s GDP. Compared to 2021, the year-on-year rate for the environmental GVA rose by 8.2%; however, this was lower than the increase in Gross Domestic Product for the economy as a whole, which rose by 10.2% during the same period.
The Environmental Goods and Services Account is part of the system of environmental accounts and is prepared according to Eurostat's methodology. These accounts allow for a coherent integration of economic and environmental aspects into the National Accounts system. The Environmental Goods and Services (Environmental Economy) sub-sector is composed of the segment of the economy dedicated to the production of goods and services for environmental protection and activities related to the management of natural resources to reduce or eliminate environmental pressures.
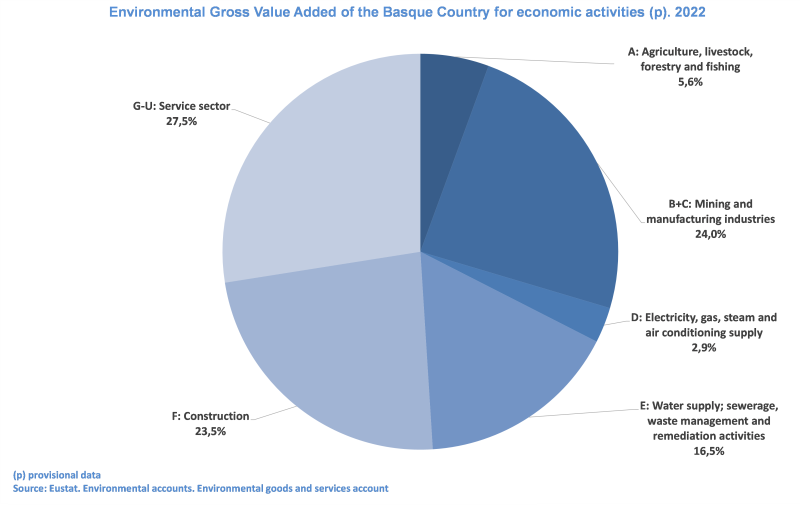
For economic sectors, and in relation to the environmental GVA, in 2022, the contribution from the Services sector stands out, with 27.5%; followed by the Extraction and Manufacturing Industries, with 24.0%; Construction, with 23.5%; Water Supply, Sanitation and Waste Management activities, with 16.5%; and finally, the sectors of Agriculture, Livestock Farming, Forestry and Fishing, and Electricity, Gas, Steam and Air Conditioning Supply, with 5.6% and 2.9% respectively.
Gross Value Added to the environmental goods and services sector of the Basque Country by activity groups (p). 2021-2022
| | 2021 | 2022 | % of Environmental GVA | Annual variation rate (%) |
| | (thousands of euros) | (thousands of euros) | 2021 | 2022 | 2022/2021 |
| TOTAL Environmental GVA | 2.010.432 | 2.175.766 | 100,0 | 100,0 | 8,2 |
| A: Agriculture, livestock, forestry and fishing | 91.764 | 122.913 | 4,6 | 5,6 | 33,9 |
| B+C: Mining and manufacturing industries | 430.759 | 521.188 | 21,3 | 24,0 | 21,0 |
| D: Electricity, gas, steam and air conditioning supply | 107.855 | 61.323 | 5,4 | 2,9 | -43,1 |
| E: Water supply; sewerage, waste management and remediation activities | 343.250 | 358.986 | 17,1 | 16,5 | 4,6 |
| F: Construction | 484.669 | 512.117 | 24,1 | 23,5 | 5,7 |
| G-U: Service sector | 552.135 | 599.239 | 27,5 | 27,5 | 8,5 |
| GDP p/m | 78.709.402 | 86.714.411 | | | 10,2 |
(p)provisional data
Date December 19, 2024
Source: Eustat. Environmental accounts. Environmental goods and services account
For the economic sectors, and in order of importance, environmental employment in the Services sector represented 32.4% of total environmental employment; it was followed by Construction, with 25.4%; the Extraction and Manufacturing Industry, with 20.4%; and Electricity, Gas, Steam and Air Conditioning Supply activities, with 16.6% For their part, the sectors that contributed the least to environmental employment were Agriculture, Livestock, Forestry and Fishing (4.8%) and Electricity, Gas, Steam and Air Conditioning Supply (0.4%).
Full-time equivalent jobs (FTE) of the Basque Country in the environmental goods and services sector by activity groups (p). 2021-2022
| | 2021 | 2022 | % on environmental employment | Annual variation rate (%) |
| | | | 2021 | 2022 | 2022/2021 |
| Total Environmental FTE | 26.481 | 27.740 | 100,0 | 100,0 | 4,8 |
| A: Agriculture, livestock, forestry and fishing | 1.093 | 1.325 | 4,1 | 4,8 | 21,2 |
| B+C: Mining and manufacturing industries | 5.049 | 5.681 | 19,1 | 20,4 | 12,5 |
| D: Electricity, gas, steam and air conditioning supply | 193 | 102 | 0,8 | 0,4 | -47,2 |
| E: Water supply; sewerage, waste management and remediation activities | 4.476 | 4.610 | 16,9 | 16,6 | 3,0 |
| F: Construction | 6.977 | 7.040 | 26,3 | 25,4 | 0,9 |
| G-U: Service sector | 8.693 | 8.982 | 32,8 | 32,4 | 3,3 |
| Full-time equivalent of the total economy | 926.449 | 953.067 | | | 2,9 |
(p)provisional data
Date December 19, 2024
Source: Eustat. Environmental accounts. Environmental goods and services account
According to the main indicators that relate environmental figures to the overall economy, the environmental GVA represented 2.51% of the GDP in 2022, while environmental employment, measured in terms of full-time equivalent jobs (FTE), represented 2.91% of total FTE employment in 2022.
Indicators of the environmental goods and services sector of the Basque Country by activity groups (p). 2021-2022
| | Environmental GVA over % GDP | Environmental Employment (FTE) over Total Employment (FTE) |
| | 2021 | 2022 | 2021 | 2022 |
| Environmental Total | 2,55 | 2,51 | 2,86 | 2,91 |
| A: Agriculture, livestock, forestry and fishing | 0,12 | 0,14 | 0,12 | 0,14 |
| B+C: Mining and manufacturing industries | 0,55 | 0,60 | 0,55 | 0,60 |
| D: Electricity, gas, steam and air conditioning supply | 0,14 | 0,07 | 0,02 | 0,01 |
| E: Water supply; sewerage, waste management and remediation activities | 0,44 | 0,41 | 0,48 | 0,48 |
| F: Construction | 0,62 | 0,59 | 0,75 | 0,74 |
| G-U: Service sector | 0,68 | 0,70 | 0,94 | 0,94 |
(p)provisional data
Date December 19, 2024
Source: Eustat. Environmental accounts. Environmental goods and services account
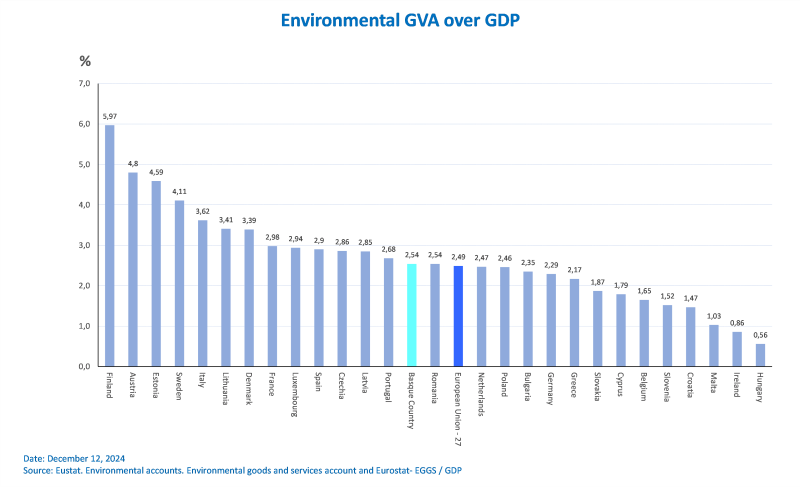
For the comparison with the rest of Europe, the latest data published by Eustat, referring to 2021 was analysed. The environmental GVA indicator on GDP in the Basque Country was estimated at 2.54%, which was slightly higher than that of countries such as Poland (2.46%) or the Netherlands (2.48%) and lower than France (2.98%) and Luxembourg (2.94%). This data places the Basque Country above the EU-27 average (2.49%), where countries like Finland (5.97%), Austria (4.80%)and Estonia (4.59%) lead the EU's environmental contribution.
The European regulations establish two general domains, which are defined on the basis of their environmental goals and are mutually exclusive: environmental protection activities and resource management activities. Environmental protection activities are described in the Classification of Environmental Protection Activities (CEPA); and resource management activities for environmental protection are described in the Classification of Resource Management Activities (CReMA).
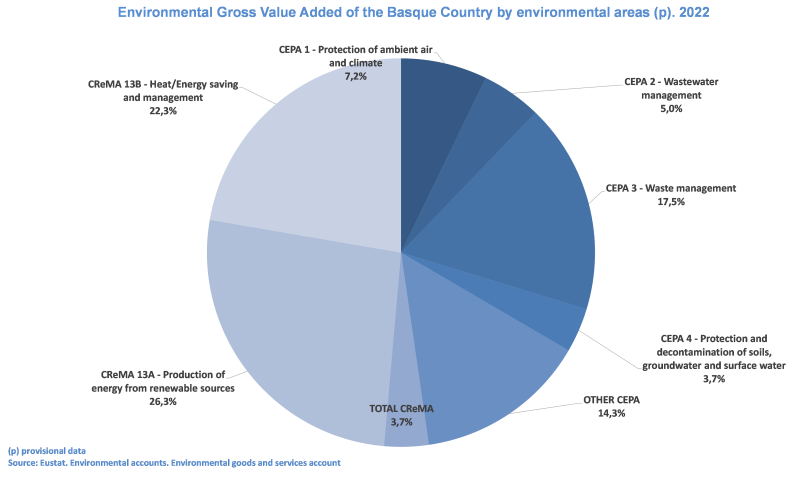
The area that stood out for having the highest environmental GVA in 2022 was Heat and Energy Saving and Management (CReMA 13B) with 26.3%; it was followed by Activities and Products Related to the Management of Water, Forestry, Fossil and Mineral Resources, with 22.3%; R&D for Environmental Management; Resource Management Education and Support for Environmental Management (CReMA Others). Activities and Products related to Waste Management (CEPA 3) also stood out, with 17.5% of the environmental GVA, as well as Other Environmental Protection Activities such as Noise Reduction, Protection of Biodiversity and Landscapes, etc. (Other CEPA), with 14.3% of the environmental GVA.
In terms of the contribution made by environmental GVA to GDP in 2022, resource management activities (CReMA) contributed 1.32%, while environmental protection activities (CEPA) contributed 1.19%. Analysing environmental employment, activities linked to CReMA resource management contributed 1.45%, compared with 1.46% from CEPA environmental protection activities.
Specifically, the environmental area that contributed the most, both to the environmental GVA and to environmental employment, was Heat/Energy Saving and Management, with 0.67% and 0.73% respectively.
Indicators of the environmental goods and services sector of the Basque Country by environmental field (p). 2021-2022
| | Environmental GVA over % GDP | Environmental Employment (FTE) over Total Employment (FTE) |
| | 2021 | 2022 | 2021 | 2022 |
| TOTAL (CEPA + CREMA) | 2,55 | 2,51 | 2,86 | 2,91 |
| TOTAL CEPA | 1,21 | 1,19 | 1,45 | 1,46 |
| CEPA 1 - Protection of ambient air and climate | 0,17 | 0,18 | 0,18 | 0,18 |
| CEPA 2 - Wastewater management | 0,15 | 0,12 | 0,17 | 0,15 |
| CEPA 3 - Waste management | 0,44 | 0,44 | 0,51 | 0,52 |
| CEPA 4 - Protection and remediation of soil, groundwater and surface water | 0,11 | 0,09 | 0,18 | 0,16 |
| OTHER CEPA | 0,34 | 0,36 | 0,41 | 0,45 |
| TOTAL CREMA | 1,34 | 1,32 | 1,41 | 1,45 |
| CReMA 13A - Production of energy from renewable sources | 0,09 | 0,09 | 0,04 | 0,07 |
| CReMA 13B - Heat/Energy saving and management | 0,71 | 0,67 | 0,75 | 0,73 |
| OTHER CREMA | 0,54 | 0,56 | 0,62 | 0,65 |
(p)provisional data
Date December 19, 2024
Source: Eustat. Environmental accounts. Environmental goods and services account
Note:
The data published for the years 2021 and 2022 incorporates a review and update of the data with the new figures from Economic Accounts, which has released the new estimates with the 2022 base year, including updated information on Added Value and Full-Time Equivalent Positions (FTE).
Furthermore, the Environmental Goods and Services Account itself, in accordance with the Eurostat recommendations and regulatory reviews by the European Commission carried out since 2015 (Regulation (EU) 2015/2174), establishes new methodologies based on the CEPA and CReMA classification and, for each environmental domain, expands the list indicating environmental goods and services and economic activities (Regulation (EU) 2024/1769). This has entailed a review both of information sources and of estimation methods, in order to improve the estimates, which have had a special impact on relevant sectors such as Energy, the Motor Industry and its auxiliaries, Materials Recovery, R&D, and the Public Administrations.
In the initial phase, an update was carried out for the years 2021 and 2022, meaning there is a cut in the data series published to date, which prevents homogeneous comparisons from being made.
For this reason, it is necessary to review the data published prior to 2021 and recalculate it taking into account the new methodologies. This review will be addressed in the second phase, in which the homogeneous data series will be made available to users.
For further information:
Eustat - Euskal Estatistika Erakundea / Basque Statistics Institute
C/ Donostia-San Sebastián, 1 01010 Vitoria-Gasteiz Press Service: servicioprensa@eustat.eus Tel.: 945 01 75 62