Press Release 17/04/2024
INDUSTRIAL SURVEY. 2022
The turnover figure for industry in the Basque Country grew by 27% in 2022 and value added rose by 15.2%
Investment was up 39.8% and exceeded 2,500 million euros for the first time since 2009
2022 was an exceptional year for Basque Industry, as shown by the extraordinary increase in both turnover (up 27% on 2021) and valued added (15.2%), according to Eustat data.
Total revenue exceeded the seventy-four thousand million euro mark for the first time to stand at 74,642 million euros at current prices in 2022, making it the highest figure since records began.
Meanwhile, gross value added at factor cost reached 16,650 million euros, 15.2% higher than in 2021, and became the second highest figure in history after that recorded in 2008. This indicator measures the economic value of the total production of goods and services, minus the resources necessary for their production, subsidies and indirect taxes.
This growth in Basque Industry in 2022 was reflected in all economic indicators. Starting with employment, the number of people employed in industry in the Basque Country increased by 1.4%. The total number of employees thus stood at 204,774, a rise of 2,824 people, who, as a whole, worked 2.5% more hours than in 2021. In turn, personnel costs increased by 6.6%.
Main economic indicators of the industry of the Basque Country by province (thousands €). 2022
| | Basque Country | 2022-2021 increase (%) | Araba/Álava | 2022-2021 increase (%) | Bizkaia | 2022-2021 increase (%) | Gipuzkoa | 2022-2021 increase (%) |
| Individuals employed NU | 204.774 | 1,4 | 42.217 | 1,4 | 80.829 | 2,1 | 81.728 | 0,7 |
| Turnover | 74.641.778 | 27,0 | 16.599.678 | 23,5 | 35.602.015 | 38,1 | 22.440.085 | 14,8 |
| Gross Value Added to factor costs | 16.649.729 | 15,2 | 3.441.656 | 10,9 | 7.131.574 | 26,9 | 6.076.499 | 6,0 |
| Expenditures on personnel | 9.810.848 | 6,6 | 2.049.352 | 6,6 | 3.783.159 | 6,8 | 3.978.337 | 6,5 |
| Apparent labor productivity | 81,3 | 13,6 | 81,5 | 9,3 | 88,2 | 24,3 | 74,4 | 5,3 |
| Personnel costs per person | 47,9 | 5,1 | 48,5 | 5,1 | 46,8 | 4,6 | 48,7 | 5,7 |
| Wage-adjusted labour productivity (%) | 169,7 | 8,0 | 167,9 | 4,0 | 188,5 | 18,9 | 152,7 | -0,4 |
Date April 17, 2024
Source: Eustat. Industrial Survey
In 2022, the Basque industrial sector registered apparent labour productivity (the output of a labour unit used in the production process) of 81,308 euros per person employed, 13.6% up on 2021, comfortably exceeding the eighty thousand euros per person mark for the first time.
Personnel costs per person were 47,911 euros, 5.1% higher than those for the previous year. If both indicators are combined, the result is the wage-adjusted labour productivity ratio, which represents how much value added is obtained per person employed taking into account average costs. The value for 2022 was 169.7% or, in other words, in terms of value added, it was 1.697 times the value of costs per person employed. This indicator increased by 8% in 2022 compared to 2021.
Likewise, investment (2,520 million euros, up 39.8% on 2021) recovered strongly from the weakness observed in 2020, the year of the COVID-19 pandemic, when there was a negative rate of 13.5%, and from the slight recovery seen in 2021 (1.2%), making 2022 the year with the most economically powerful investment since 2009.
Provincial analysis
The turnover figure grew considerably in all three provinces, but it was Bizkaia that saw the most significant increase. Of the 15,884 million more euros in turnover in 2022 in the Autonomous Region as a whole, Bizkaia absorbed 9,827 million (61.9%), as a result of its turnover soaring by 38.1%. There was also a sharp rise in turnover of 23.5% in Álava, while growth in Gipuzkoa, although still considerable, stood at a comparatively low 14.8%.
With regard to industrial employment, the provincial performance was similar to that of turnover; Bizkaia saw the greatest increase in employment (2.1%), while Álava and Gipuzkoa posted rises of 1.4% and 0.7%, respectively.
Logically, the aforementioned results had a knock-on effect on the gross value added generated by industry in each province. Thus, the figure for 2022 was 26.9% higher than that for 2021 in Bizkaia, 10.9% higher in Álava and 6% higher in Gipuzkoa. Measured per person employed, apparent labour productivity revealed that Bizkaia and Gipuzkoa were the provinces at either end of the scale: in the former, the upturn in productivity stood at 24.3%, while in the latter, it was 5.3%; Álava, in between the two, saw its average productivity rise by 9.3%.
In contrast to what occurred in the other indicators, Bizkaia was the province where costs per person employed underwent the least adjustment, with an increase of 4.6% compared to 5.1% in Álava and 5.7% in Gipuzkoa. Thus, the average cost per person in Bizkaia was the lowest out of the three provinces, standing at 46,804 euros, while in Álava it was 48,543 euros and in Gipuzkoa 48,678 euros. With these data, the wage-adjusted labour productivity coefficient was 152.7% of average costs in Gipuzkoa, whereas in Álava it reached 167.9% and Bizkaia 188.5%.
Sector-level analysis
In 2022, the main sectors in the Basque Country in terms of value added were Manufacture of metal products, except machinery and equipment, Metallurgy, manufacture of iron, steel and ferro-alloy products and Manufacture of machinery and equipment n.e.c. The Manufacture of metal products sector alone accumulated 19.4% of the total value added of Basque industry and these three sectors together accounted for almost 40% of the total (39.7%).
It should be noted that the percentages of total value added of industry for these three sectors were in line with the total number of people employed in industry. Thus, Manufacture of metal products accounted for 24.8% of total employment, Manufacture of machinery and equipment for 11.3% and Metallurgy for 8%.
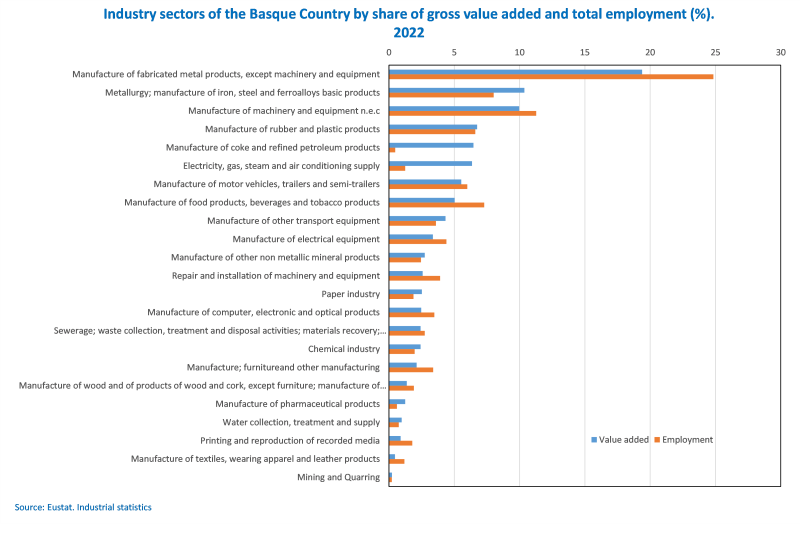
In fact, the latter sub-sector, Metallurgy, and Manufacture of metal products were two of the main contributors to the excellent performance of industry in this indicator, as they recorded increases of 11% and 10.5%, respectively, in relation to 2021.
However, it should be mentioned in this section that the sectors of Coke plants and oil refining and Electricity, gas, steam and air conditioning supply were the main drivers of the rise in value added, although they only accounted for 0.5% and 1.2%, respectively, of people employed in Basque industry.
As regards turnover, and for average growth of 27%, the ranking was once again topped by Coke plants and oil refining and Electricity, with rises of 92.1% and 38.8%. Sales also increased significantly in important sub-sectors in terms of their weight in Basque industry, such as Iron and steel industry (29.8%) and Manufacture of motor vehicles (18.9%), among others, within the general context of an increase in turnover.
Meanwhile, it is worth noting that Basque industry sub-sectors had very different characteristics. Apparent labour productivity ranged from 32 thousand euros per person employed for Textile, garments, leather and footwear industries to 1,107 thousand for Coke plants and oil refining. Other sectors with high apparent labour productivity were Electricity, gas, steam and air conditioning supply and Manufacture of pharmaceutical products, the former with productivity in excess of 417 thousand euros per person and the latter with productivity close to 166 thousand euros. On the other hand, standing out for their very low apparent labour productivity were Textile, garments, leather and footwear industries (31,725 euros per person) and the Printing and reproduction of recorded media sector (40,683 euros).
Average personnel costs per person followed a similar trend, ranging from 22,900 euros per person for Textile, garments, leather and footwear industries to 108,963 euros per person employed for the Coke plants and oil refining sector.
Main economic indicators of the industry of the Basque Country by sector (A64). Thousands €. 2022


| | Individuals employed NU | Turnover | Value added | Expenditures on personnel | Apparent labor productivity | Personnel costs per person | Wage-adjusted labour productivity (%) |
| Mining and quarrying | 445 | 116.609 | 38.271 | 24.094 | 86,0 | 54,1 | 158,8 |
| Manufacture of food products, beverages and tobacco products | 14.932 | 4.785.193 | 837.812 | 517.710 | 56,1 | 34,7 | 161,8 |
| Manufacture of textiles, wearing apparel and leather products | 2.429 | 228.349 | 77.060 | 55.625 | 31,7 | 22,9 | 138,5 |
| Manufacture of wood and of products of wood and cork, except furniture; manufacture of articles of straw and plaiting materials | 3.908 | 740.827 | 226.958 | 138.237 | 58,1 | 35,4 | 164,2 |
| Manufacture of paper and paper products | 3.839 | 1.890.331 | 420.322 | 209.712 | 109,5 | 54,6 | 200,4 |
| Printing and reproduction of recorded media | 3.654 | 375.075 | 148.657 | 117.261 | 40,7 | 32,1 | 126,8 |
| Coke and refined petroleum | 973 | 9.992.681 | 1.076.930 | 106.021 | 1.106,8 | 109,0 | 1.015,8 |
| Chemical industry | 4.029 | 1.798.108 | 402.945 | 216.300 | 100,0 | 53,7 | 186,3 |
| Manufacture of pharmaceutical products | 1.248 | 455.247 | 206.804 | 72.996 | 165,7 | 58,5 | 283,3 |
| Manufacture of rubber and plastic products | 13.527 | 3.864.751 | 1.124.566 | 647.934 | 83,1 | 47,9 | 173,6 |
| Manufacture of other non metallic mineral products | 5.021 | 1.396.692 | 455.738 | 262.169 | 90,8 | 52,2 | 173,8 |
| Metallurgy, manufacture of iron, steel and ferroalloys basic products | 16.415 | 9.118.859 | 1.725.840 | 947.559 | 105,1 | 57,7 | 182,1 |
| Manufacture of fabricated metal products, except machinery and equipment | 50.865 | 9.217.238 | 3.226.983 | 2.280.238 | 63,4 | 44,8 | 141,5 |
| Manufacture of computer, electronic and optical products | 7.119 | 1.200.774 | 411.013 | 290.676 | 57,7 | 40,8 | 141,4 |
| Manufacture of electrical equipment | 9.009 | 2.133.513 | 559.971 | 428.583 | 62,2 | 47,6 | 130,7 |
| fabricacion de maquinaria y equipo n.e.c | 23.093 | 5.743.572 | 1.659.034 | 1.203.493 | 71,8 | 52,1 | 137,9 |
| Manufacture of motor vehicles, trailers and semi-trailers | 12.272 | 6.594.335 | 922.233 | 685.010 | 75,1 | 55,8 | 134,6 |
| Manufacture of other transport equipment | 7.353 | 2.964.526 | 721.613 | 483.140 | 98,1 | 65,7 | 149,4 |
| Manufacture; furnitureand other manufacturing | 6.923 | 1.110.470 | 352.938 | 237.383 | 51,0 | 34,3 | 148,7 |
| Repair and installation of machinery and equipment | 8.014 | 967.390 | 429.556 | 359.772 | 53,6 | 44,9 | 119,4 |
| Electricity, gas, steam and air conditioning supply | 2.538 | 8.531.954 | 1.059.548 | 203.563 | 417,5 | 80,2 | 520,5 |
| Water collection, treatment and supply | 1.546 | 345.392 | 161.277 | 86.984 | 104,3 | 56,3 | 185,4 |
| Collection and treatment of residual water; waste treatment and disposal... | 5.622 | 1.069.892 | 403.660 | 236.388 | 71,8 | 42,0 | 170,8 |
Date April 17, 2024
Source: Eustat. Industrial Survey
For further information:
Eustat - Euskal Estatistika Erakundea / Basque Statistics Institute
C/ Donostia-San Sebastián, 1 01010 Vitoria-Gasteiz
Press Service: servicioprensa@eustat.eus Tel.: 945 01 75 62