Press Release 31/10/2023
ENVIRONMENTAL ACCOUNTS. ENVIRONMENTAL GOODS AND SERVICES ACCOUNT. 2021
(This note has been revised due to errors detected in the sectoral aggregation processes)
The gross value added generated by the environmental economy in the Basque Country grew by 7.5% in 2021
In terms of employment, the environmental economy created 21,384 jobs, 2.3% of the total for the economy
According to Eustat figures, in 2021 the environmental economy in the Basque Country generated gross value added (GVA) of 1,519 million euros, representing 1.95% of the region’s GDP. Compared to 2020, the year-on-year rate for environmental GVA rose by 7.5%; however, this was lower than the increase in Gross Domestic Product for the economy as a whole, which rose by 8.6% during the same period.
The Environmental Goods and Services Account is part of the system of environmental accounts and is prepared according to Eurostat's methodology. These accounts allow for a coherent integration of economic and environmental aspects within the National Accounts system. The Environmental Goods and Services (Environmental Economy) sub-sector is composed of the segment of the economy dedicated to the production of goods and services for environmental protection and activities related to the management of natural resources to reduce or eliminate environmental pressures.
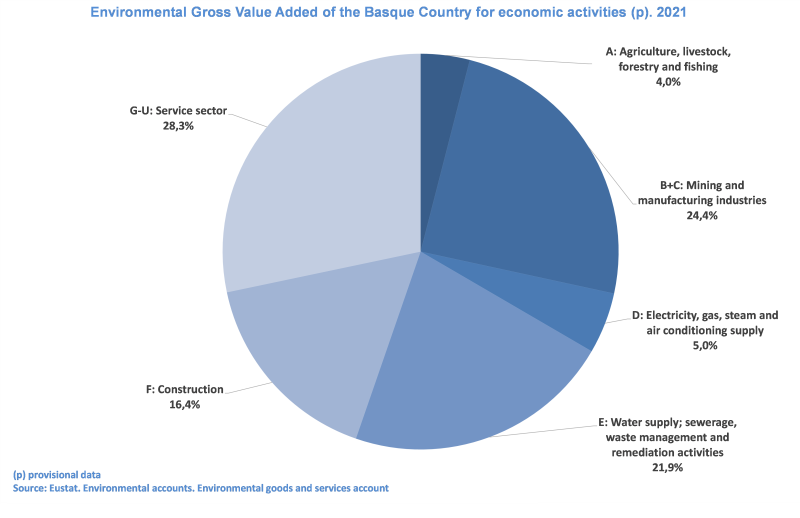
By economic sectors and in relation to GVA, in 2021, the contribution of Services stands out, with 28.3%; followed by Extractive and Manufacturing Industries, with 24.4%; Water Supply, Sanitation and Waste Management activities, with 21.9%; Construction, with 16.4%; and, finally, the Supply of electricity, gas, steam and air, and the Agriculture, Livestock, Forestry and Fisheries sector, with 5.0% and 4.0%, respectively.
Gross Value Added to the environmental goods and services sector of the Basque Country by activity groups (provisional data) . 2019-2021
| | 2019 | 2020 | 2021 | % of Environmental GVA | Annual variation rate (%) |
| | (thousands of euros) | (thousands of euros) | (thousands of euros) | 2019 | 2020 | 2021 | 2020/2019 | 2021/2020 |
| TOTAL Environmental GVA | 1.476.373 | 1.413.132 | 1.518.981 | 100,0 | 100,0 | 100,0 | -4,3 | 7,5 |
| A: Agriculture, livestock, forestry and fishing | 50.307 | 39.171 | 60.383 | 3,4 | 2,8 | 4,0 | -22,1 | 54,2 |
| B+C: Mining and manufacturing industries | 383.397 | 361.634 | 371.443 | 26,0 | 25,5 | 24,4 | -5,7 | 2,7 |
| D: Electricity, gas, steam and air conditioning supply | 86.684 | 79.329 | 75.473 | 5,9 | 5,6 | 5,0 | -8,5 | -4,9 |
| E: Water supply; sewerage, waste management and remediation activities | 315.992 | 296.470 | 332.538 | 21,4 | 21,0 | 21,9 | -6,2 | 12,2 |
| F: Construction | 260.151 | 228.587 | 249.470 | 17,6 | 16,2 | 16,4 | -12,1 | 9,1 |
| G-U: Service sector | 379.842 | 407.941 | 429.674 | 25,7 | 28,9 | 28,3 | 7,4 | 5,3 |
| GDP p/m | 79.537.107 | 71.828.616 | 78.038.814 | | | | -9,7 | 8,6 |
Date October 31, 2023
Source: Eustat. Environmental accounts. Environmental goods and services account
Regarding the evolution over time, it can be seen that in some of the sectors the environmental GVA for 2021 is still not close to pre-pandemic values. This is the case of the Extractive and Manufacturing Industries which, despite reflecting a year-on-year growth rate of environmental GVA of 2.7%, is still below the estimated values for 2019. Likewise, the Supply of Electricity, Gas, Steam and Air Conditioning sector, with an annual variation rate of -4.9%, and the Construction sector, with an increase of 9.1%, did not recover the aforementioned levels either. In turn, the sectors that are already at levels prior to and even higher than the pandemic are Agriculture, Livestock, Forestry and Fisheries, with a year-on-year rate of variation of 54.2%; Water supply, sanitation, waste management and decontamination, with 12.2%; and, finally, Services, with 5.3%.
Full-time equivalent jobs (FTE) of the Basque Country in the environmental goods and services sector by activity groups (provisional data). 2019-2021
| | 2019 | 2020 | 2021 | % on environmental employment | Annual variation rate (%) |
| | | | | 2019 | 2020 | 2021 | 2020/2019 | 2021/2020 |
| Total Environmental FTE | 21.336 | 20.939 | 21.384 | 100,0 | 100,0 | 100,0 | -1,9 | 2,1 |
| A: Agriculture, livestock, forestry and fishing | 738 | 758 | 714 | 3,5 | 3,6 | 3,3 | 2,7 | -5,8 |
| B+C: Mining and manufacturing industries | 5.557 | 4.985 | 4.791 | 26,0 | 23,8 | 22,4 | -10,3 | -3,9 |
| D: Electricity, gas, steam and air conditioning supply | 48 | 58 | 56 | 0,2 | 0,3 | 0,3 | 20,8 | -3,4 |
| E: Water supply; sewerage, waste management and remediation activities | 4.305 | 4.194 | 4.343 | 20,2 | 20,0 | 20,3 | -2,6 | 3,6 |
| F: Construction | 4.475 | 4.141 | 4.494 | 21,0 | 19,8 | 21,0 | -7,5 | 8,5 |
| G-U: Service sector | 6.213 | 6.803 | 6.986 | 29,1 | 32,5 | 32,7 | 9,5 | 2,7 |
| Full-time equivalent of the total economy | 974.811 | 914.369 | 939.512 | | | | -6,2 | 2,7 |
Date October 31, 2023
Source: Eustat. Environmental accounts. Environmental goods and services account
By economic sector, and in order of importance, environmental employment in the Services sector represents 32.7% of total environmental employment; followed by the Extractive and Manufacturing Industry, with 22.4%; Construction with 21.0%; and Water Supply, Sanitation and Waste Management activities with 20.3%. In turn, the sectors with the lowest contribution to total environmental employment are Agriculture, livestock, forestry and fisheries, and the Supply of electricity, gas, steam and air, with 3.3% and 0.3%, respectively.
Indicators of the environmental goods and services sector of the Basque Country by activity groups (provisional data). 2019-2021
| | Environmental GVA over % GDP | Environmental Employment (FTE) over Total Employment (FTE) |
| | 2019 | 2020 | 2021 | 2019 | 2020 | 2021 |
| Environmental Total | 1,86 | 1,96 | 1,95 | 2,19 | 2,29 | 2,28 |
| A: Agriculture, livestock, forestry and fishing | 0,06 | 0,05 | 0,08 | 0,08 | 0,08 | 0,08 |
| B+C: Mining and manufacturing industries | 0,48 | 0,50 | 0,48 | 0,57 | 0,55 | 0,51 |
| D: Electricity, gas, steam and air conditioning supply | 0,11 | 0,11 | 0,10 | 0,00 | 0,01 | 0,01 |
| E: Water supply; sewerage, waste management and remediation activities | 0,40 | 0,41 | 0,43 | 0,44 | 0,46 | 0,46 |
| F: Construction | 0,33 | 0,32 | 0,32 | 0,46 | 0,45 | 0,48 |
| G-U: Service sector | 0,48 | 0,57 | 0,54 | 0,64 | 0,74 | 0,74 |
Date October 31, 2023
Source: Eustat. Environmental accounts. Environmental goods and services account
According to the main indicators that relate environmental figures to the total economy, environmental GVA represents 1.95% of GDP in 2021; and environmental employment, measured in terms of full-time equivalent (FTE) jobs, accounts for 2.28% of total FTE employment in 2021.
For comparison with the rest of Europe, the latest data published by Eurostat in 2020 are analysed. The indicator of environmental GVA over GDP in the Basque Country is estimated at 1.96%, a percentage higher than that of countries such as Belgium (1.67%) or Ireland (0.98%); and, similar to that of neighbouring countries such as France (2.00%) and lower than Germany (2.39%). These data place the Basque Country below the EU-27 average (2.53%), where countries such as Finland (6.24%), Estonia (4.97%) and Austria (4.38%) lead environmental production in the EU.
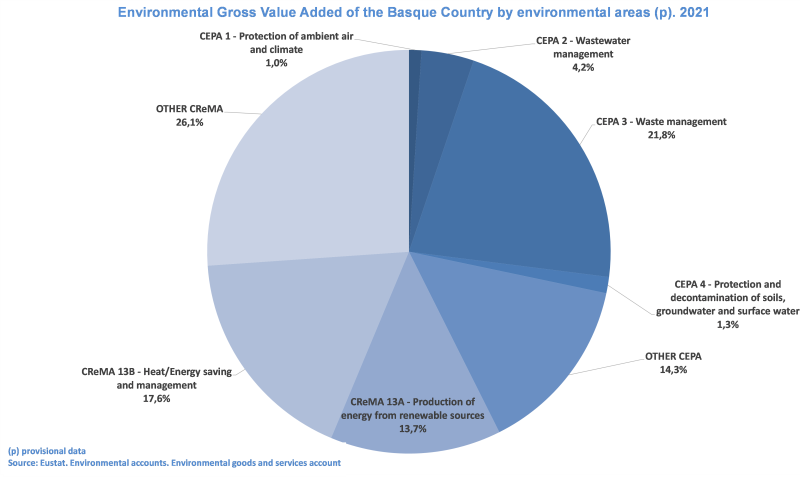
In accordance with European regulations, two main areas are distinguished according to their environmental purpose: environmental protection activities and resource management activities, which are mutually exclusive. Environmental protection activities are described in the Classification of Environmental Protection Activities (CEPA); and, resource management environmental protection activities are described in the Resource Management Activity Classification (CReMA).
The area that stands out for its greatest weight in environmental GVA in 2021 is Other CReMA with 26.1%, i.e. activities and products related to the management of water, forest, fossil and mineral resources; R+D for environmental management; resource management education; and, support for environmental management. Also noteworthy are the activities and products related to Waste Management (CEPA 3), which represents 21.8% of the environmental GVA; energy and heat management and saving (CReMA 13B), 17.6%; and energy production from renewable sources (CReMA 13A), 13.7%.
Indicators of the environmental goods and services sector of the Basque Country by environmental field (provisional data). 2019-2021
| | Environmental GVA over % GDP | Environmental Employment (FTE) over Total Employment (FTE) |
| | 2019 | 2020 | 2021 | 2019 | 2020 | 2021 |
| TOTAL (CEPA + CREMA) | 1,86 | 1,96 | 1,95 | 2,19 | 2,29 | 2,28 |
| TOTAL CEPA | 0,83 | 0,87 | 0,83 | 1,08 | 1,10 | 1,08 |
| CEPA 1 - Protection of ambient air and climate | 0,02 | 0,02 | 0,02 | 0,03 | 0,02 | 0,02 |
| CEPA 2 - Wastewater management | 0,10 | 0,10 | 0,08 | 0,09 | 0,09 | 0,08 |
| CEPA 3 - Waste management | 0,42 | 0,43 | 0,43 | 0,57 | 0,56 | 0,56 |
| CEPA 4 - Protection and remediation of soil, groundwater and surface water | 0,03 | 0,03 | 0,02 | 0,05 | 0,05 | 0,04 |
| OTHER CEPA | 0,26 | 0,29 | 0,28 | 0,34 | 0,38 | 0,38 |
| TOTAL CREMA | 1,03 | 1,09 | 1,12 | 1,11 | 1,19 | 1,20 |
| CReMA 13A - Production of energy from renewable sources | 0,23 | 0,27 | 0,27 | 0,15 | 0,15 | 0,15 |
| CReMA 13B - Heat/Energy saving and management | 0,34 | 0,33 | 0,34 | 0,45 | 0,45 | 0,49 |
| OTHER CREMA | 0,46 | 0,49 | 0,51 | 0,51 | 0,59 | 0,56 |
Date October 31, 2023
Source: Eustat. Environmental accounts. Environmental goods and services account
In terms of the contribution of environmental GVA to GDP, resource management activities (CReMA) contribute 1.12%; while environmental protection (CEPA) contributed 0.83% in 2021. Analysing environmental employment, activities linked to CReMA resource management are the ones that weigh the most on the total: 1.20% compared to 1.08% for CEPA environmental protection activities. Specifically, the environmental areas that contributed the most to employment were Other CReMA and CEPA 3 -Waste management-, both with 0.56%; and CReMA 13B (Energy/Heat Management and Saving), with 0.49%.
Para más información:
Eustat - Euskal Estatistika Erakundea / Instituto Vasco de Estadística
C/ Donostia-San Sebastián, 1 01010 Vitoria-Gasteiz
Servicio de Prensa: servicioprensa@eustat.eus Tlf: 945 01 75 62