Press Release 27/04/2023
INDUSTRIAL STATISTICS. 2021
The turnover figure for Industry in the Basque Country grew by 19% in 2021
Employment once again recorded a positive rate of 0.5% and the number of hours worked increased by 5.1%
In 2021, the activity of Basque Industry recovered from the drop registered the previous year, due to the effects of the COVID-19 pandemic, as reflected in a 19% increase in turnover, according to Eustat data.
This recovery was felt in virtually all economic indicators. With a 0.5% increase in the number of people employed, employment recovered the positive trend registered in the last years prior to the pandemic, although it did not reach the previous figures. The total number of people employed stood at 201,950, 933 more than in 2020, although still below the 2019 figures. The number of hours worked recorded a stronger upturn, up 5.1% from 2020.
Basque Industry, which encompasses the manufacturing industry, extraction industries, electricity, gas & steam and water supply & sanitation, carried out its activity in a total of 11,138 establishments, down 0.3% on the previous year.
Turnover reached 58,757 million euros at current prices in 2021, 19% higher than in 2020, but still below the 2019 figure. In turn, personnel costs increased by 3.9% compared to the previous year.
Gross value added at factor cost (GVAFC) is a macroeconomic indicator that represents the economic value of the total production of goods and services, minus the inputs necessary for that production and indirect taxes. In 2021, the gross value added generated by the industrial sector in the Basque Country reached 14,455 million euros, 9.9% higher than in 2020.
Main economic indicators of the industry of the Basque Country by province (thousands €). 2021
| | Basque Country | 2021-2020 (increase %) | Araba/Álava | 2021-2020 (increase %) | Bizkaia | 2021-2020 (increase %) | Gipuzkoa | 2021-2020 (increase %) |
| Individuals employed NU | 201.950 | 0,5 | 41.618 | -0,1 | 79.181 | 0,1 | 81.151 | 1,1 |
| Turnover | 58.757.265 | 19,0 | 13.440.560 | 14,0 | 25.774.737 | 23,0 | 19.541.968 | 17,6 |
| Gross Value Added to factor costs | 14.454.664 | 9,9 | 3.103.153 | 7,6 | 5.618.880 | 13,6 | 5.732.631 | 7,8 |
| Expenditures on personnel | 9.202.819 | 3,9 | 1.921.837 | 4,7 | 3.543.849 | 2,7 | 3.737.133 | 4,7 |
| Apparent labor productivity | 71,6 | 9,4 | 74,6 | 7,7 | 71,0 | 13,4 | 70,6 | 6,7 |
| Personnel costs per person | 45,6 | 3,4 | 46,2 | 4,8 | 44,8 | 2,6 | 46,1 | 3,6 |
| Wage-adjusted labour productivity (%) | 157,1 | 5,8 | 161,5 | 2,8 | 158,6 | 10,5 | 153,4 | 3,0 |
Date April 27, 2023
Source: Eustat. Industrial Survey
In 2021, the Basque industrial sector registered apparent labour productivity (the output of a labour unit used in the production process) of 71,575 euros per person employed, 9.4% down on 2020, while personnel costs per person were 45,570 euros, 3.4% higher than those for the previous year. If both indicators are combined, the result is the wage-adjusted labour productivity ratio, which represents how much value added is obtained per person employed taking into account average costs. The value for 2021 was 157.1% or, in other words, in terms of value added, it was 1.57 times the value of costs per person employed. This indicator has increased by 5.8% in 2021 compared to 2020.
In keeping with these figures, the operating income, or earnings before interest and taxes, rose by 86.2%. Conceptually, the operating income indicates whether a company has made a profit or loss at the end of a financial year with regard to its main activity. The rise in operating income in 2021 was close to the highest recorded in 2014 (99.5%).
Provincial analysis
Recovery from the effects of the pandemic was reflected in all three provinces, albeit to varying degrees.
Taking into account the main indicators, Bizkaia was the province that showed the greatest recovery and Álava the one that, relatively, has recovered to a lesser extent from this health crisis.
The turnover figure grew considerably in all three provinces, but it was Bizkaia that saw the most significant increase, where it was 23% above that for the previous year, while the rise stood at just 17.6% in Gipuzkoa and 14% in Álava.
With regard to industrial employment, there were varying trends; while in Gipuzkoa and Bizkaia the variations, although not significant, were positive, 1.1% and 0.1%, respectively, in Álava industrial employment dropped by 0.1%. The number of hours worked, on the other hand, registered positive rates in all three provinces and to a greater degree: 5.7% in Gipuzkoa, 5.6% in Bizkaia and 2.9% in Álava. As regards the number of industrial establishments, this figure dropped by 1% in Bizkaia and 0.3% in Álava, while it was up 0.5% in Gipuzkoa. Furthermore, personnel costs rose to a greater extent in Álava and Gipuzkoa, with a 4.7% increase in both provinces, and slightly less in Bizkaia (2.7%).
As a result of the evolution of the different components, the gross value added generated by industry in the three provinces registered a very positive evolution. Thus, the figure for 2021 was 13.6% higher than that for 2020 in Bizkaia, 7.8% higher in Gipuzkoa and 7.6% higher in Álava. Measured per person employed, apparent labour productivity revealed that Bizkaia and Gipuzkoa were the provinces at either end of the scale: in the former, the upturn in productivity stood at 13.4%, while in the latter, it barely reached 6.7%; Álava, in between the two, saw its average productivity rise by 7.7%.
Contrary to what occurred in the other indicators, Bizkaia was the province where costs per person employed underwent the least adjustment, with an increase of 2.6% compared to 3.6% in Gipuzkoa and 4.8% in Álava. Thus, the average cost per person in Bizkaia was the lowest out of the three provinces, standing at 44,756 euros, while in Gipuzkoa it was 46,052 euros and in Álava 46,178 euros. Based on these data, we can conclude that the wage-adjusted labour productivity coefficient was 153.4% of average costs in Gipuzkoa, whereas in Bizkaia it was 158.6% and in Álava 161.5%.
Sector-level analysis
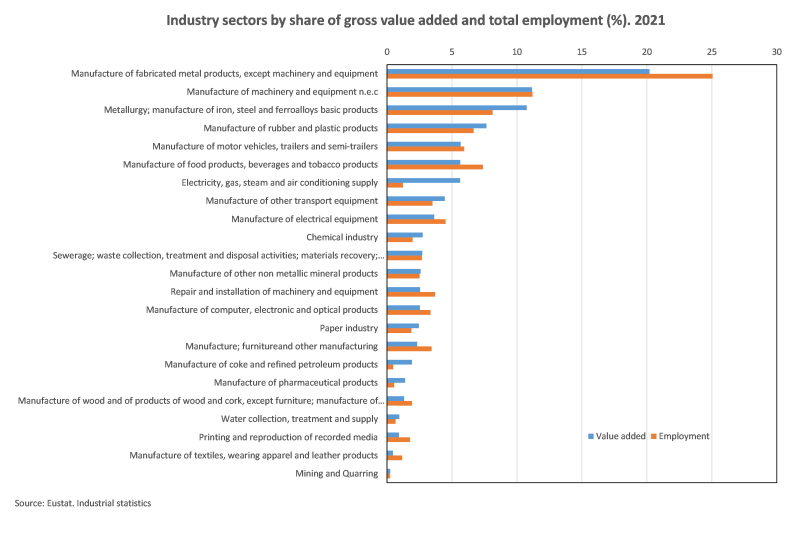
In 2021, the main sectors in the Basque Country in terms of value added were Manufacture of fabricated metal products, except machinery and equipment, Manufacture of machinery and equipment n.e.c. and Metallurgy, manufacture of iron, steel and ferro-alloy products. In all three, the value added was well in excess of one billion euros and, in the case of the first sector, even two billion euros. The Manufacture of fabricated metal products sector alone accumulated 20.2% of the total value added of Basque industry and these three sectors together accounted for more than 40% of the total (42.1%).
It should be noted that the percentages of total value added of industry for these three sectors were in line with the total number of people employed in the industry. Thus, Manufacture of metal products accounted for 25.1% of total employment, Manufacture of machinery and equipment for 11.2% and Metallurgy for 8.1%.
Other sectors with significant values added were: Manufacture of rubber and plastic products (7.7%), Manufacture of motor vehicles, trailers and semi-trailers (5.7%), Food, beverage & tobacco industry (5.6%) and Electricity, gas, steam and air conditioning supply (5.6%). In the first three cases, their percentages of employment were in line with their respective values added, which, following the same order, were: 6.7%, 5.9% and 7.4%. However, it is worth mentioning that the Electricity, gas, steam and air conditioning supply sector accounted for 5.6% of total value added of industry with just 1.2% of people employed.
On the other hand, Basque industry subsectors were very diverse, as they combined activities with relatively low apparent labour productivity and average personnel costs, such as Textile, garments, leather and footwear industries, Printing and reproduction of recorded media, Manufacture of furniture; other manufacturing industries or Timber and cork industry, except furniture; manufactures of straw, of esparto or of other plaiting materials; basketware and wickerwork, with other activities that had considerably higher values for the same indicators. Among the latter, Collection, purification and distribution of water, Manufacture of pharmaceutical products, Coke plants & oil refining and Electricity, gas, steam and air conditioning supply are worth particular mention.
In 2021, apparent labour productivity within the subsectors ranged from 29,000 euros per person employed for Textile, garments, leather and footwear industries to 327,000 euros for Electricity, gas, steam and air conditioning supply.
Other sectors with high apparent labour productivity were Coke plants & oil refining and Manufacture of pharmaceutical products, the former with productivity in excess of 285,000 euros per person and the latter with productivity close to 181,000 euros.
In keeping with their very low apparent labour productivity, Textile, garments, leather and footwear industries (28,680 euros per person) and the Printing and reproduction of recorded media sector (37,519 euros) recorded the lowest average personnel costs, with 21,009 euros and 29,055 euros per person employed, respectively.
Average personnel costs per person were 85,466 euros per person employed for the Electricity, gas, steam and air conditioning supply sector and 97,990 euros for the Coke plants & oil refining sector. As indicated above, both sectors also registered the highest apparent labour productivity and, together with Manufacture of pharmaceutical products, the highest wage-adjusted labour productivity ratio with quotients of 296% for the latter and 383% and 291.4%, respectively, in the case of Electricity, gas, steam and air conditioning supply and Coke plants & oil refining.
Moreover, the Repair and installation of machinery and equipment sector recorded the lowest level of wage-adjusted labour productivity with 118.4%.
Main economic indicators of the industry of the Basque Country by sector (A64). Thousands €. 2021


| | Individuals employed NU | Turnover | Value added | Expenditures on personnel | Apparent labor productivity | Personnel costs per person | Wage-adjusted labour productivity (%) |
| Mining and quarrying | 480 | 119.222 | 35.825 | 24.129 | 74,6 | 50,3 | 148,5 |
| Manufacture of food products, beverages and tobacco products | 14.906 | 4.136.998 | 815.702 | 496.232 | 54,7 | 33,3 | 164,4 |
| Manufacture of textiles, wearing apparel and leather products | 2.350 | 196.040 | 67.397 | 49.370 | 28,7 | 21,0 | 136,5 |
| Manufacture of wood and of products of wood and cork, except furniture; manufacture of articles of straw and plaiting materials | 3.884 | 618.319 | 190.358 | 128.902 | 49,0 | 33,2 | 147,7 |
| Manufacture of paper and paper products | 3.813 | 1.470.035 | 355.884 | 195.406 | 93,3 | 51,2 | 182,1 |
| Printing and reproduction of recorded media | 3.579 | 313.825 | 134.282 | 103.989 | 37,5 | 29,1 | 129,1 |
| Coke and refined petroleum | 976 | 5.200.504 | 278.679 | 95.638 | 285,5 | 98,0 | 291,4 |
| Chemical industry | 3.996 | 1.522.035 | 396.857 | 210.101 | 99,3 | 52,6 | 188,9 |
| Manufacture of pharmaceutical products | 1.123 | 413.737 | 203.063 | 68.711 | 180,8 | 61,2 | 295,5 |
| Manufacture of rubber and plastic products | 13.471 | 3.333.089 | 1.106.611 | 641.083 | 82,1 | 47,6 | 172,6 |
| Manufacture of other non metallic mineral products | 5.067 | 1.110.995 | 373.762 | 239.374 | 73,8 | 47,2 | 156,1 |
| Metallurgy, manufacture of iron, steel and ferroalloys basic products | 16.415 | 7.084.731 | 1.555.471 | 877.167 | 94,8 | 53,4 | 177,3 |
| Manufacture of fabricated metal products, except machinery and equipment | 50.615 | 7.745.923 | 2.920.852 | 2.163.271 | 57,7 | 42,7 | 135,0 |
| Manufacture of computer, electronic and optical products | 6.773 | 976.314 | 367.071 | 268.016 | 54,2 | 39,6 | 137,0 |
| Manufacture of electrical equipment | 9.115 | 1.905.957 | 526.089 | 407.745 | 57,7 | 44,7 | 129,0 |
| fabricacion de maquinaria y equipo n.e.c | 22.628 | 5.144.415 | 1.613.358 | 1.130.327 | 71,3 | 50,0 | 142,7 |
| Manufacture of motor vehicles, trailers and semi-trailers | 11.993 | 5.546.504 | 820.400 | 616.843 | 68,4 | 51,4 | 133,0 |
| Manufacture of other transport equipment | 7.078 | 2.659.388 | 643.104 | 453.582 | 90,9 | 64,1 | 141,8 |
| Manufacture; furnitureand other manufacturing | 6.943 | 994.255 | 336.895 | 219.840 | 48,5 | 31,7 | 153,2 |
| Repair and installation of machinery and equipment | 7.480 | 805.034 | 368.855 | 311.504 | 49,3 | 41,6 | 118,4 |
| Electricity, gas, steam and air conditioning supply | 2.487 | 6.254.053 | 813.991 | 212.554 | 327,3 | 85,5 | 383,0 |
| Water collection, treatment and supply | 1.350 | 263.407 | 137.481 | 70.955 | 101,8 | 52,6 | 193,8 |
| Collection and treatment of residual water; waste treatment and disposal... | 5.428 | 942.485 | 392.677 | 218.080 | 72,3 | 40,2 | 180,1 |
Date April 27, 2023
Source: Eustat. Industrial Survey
For further information:
Eustat - Euskal Estatistika Erakundea / Basque Statistics Institute
C/ Donostia-San Sebastián, 1 01010 Vitoria-Gasteiz
Press Service: servicioprensa@eustat.eus Tel.: 945 01 75 62