Press Release 25/10/2022
EQUITY ACCOUNTS OF NON-FINANCIAL COMPANIES 2020
COVID-19 cuts short the positive trend of non-financial companies in the Basque Country, reducing their economic profitability by 1.8 percentage points in 2020
In 2020, fixed assets of non-financial companies grew by 2.7%, as did non-current liabilities, by 17.7%
The economic profitability of non-financial companies in the Basque Country stood at 3.2% in 2020, according to Eustat data.
This figure has cut short the clearly positive trend that started in 2014, a period in which profitability was near to or greater than 4%, reaching a maximum in 2019 when economic profitability stood at 5%. The 2020 result represents a decrease of 1.8 percentage points in the ratio of economic profitability compared to the previous year, taking it back to the values registered at the start of the decade.
It should be taken into account that in 2020, the travel restrictions adopted as of March due to the COVID-19 pandemic had an extraordinary impact on economic activity.
The Economic Profitability ratio provides information on a company's average return on its total assets, and hence the effectiveness of the company's management. Higher values mean that fewer assets are required to achieve higher profits.
As regards the sector of economic activity, in 2020 the economic profitability of Pharmaceutical products, 9.3%; Chemical industry, 8.9% and Consultancy & technical activities together with Healthcare activities in the market, both with an economic profitability of 6.4%, came out on top. However, they are all sectors with traditionally high economic profitability. Conversely, only three of the thirty-three sectors analysed registered negative profitability, namely Metallurgy & metal products, -0.4%; Recreational and cultural activities, -1% and Hospitality, the most affected sector with negative profitability of 7%, while in 2019 they recorded profitability of 3.3%, 4% and 4.4%, respectively.
There are some variations, depending on the size of the companies. Thus, micro-enterprises and medium-sized companies (from 1 to 9 and from 10 to 49 employees) had a more favourable economic profitability ratio, 3.6% for both sizes, compared to companies with 50 or more employees, with 2.6%. The reason is the greater loss of profitability of the latter in 2020, down 2.8 percentage points compared to 2019, while medium-sized companies dropped 2 percentage points and micro-enterprises only 0.7 percentage points.
A metric closely related to economic profitability is Current Asset Turnover. This ratio shows the number of times current assets have been used to generate sales, thereby quantifying the use of available sales resources. A high ratio denotes a good use of available resources.
In 2020, the ratio was 1.6 times for non-financial companies in the Basque Country, two tenths less than in 2019. In other words, current assets were turned over 1.6 times in a year and hence current assets were capable of generating more than one and a half sales in a year.
Some sectors exceeded the general average. This was the case for Electricity, gas & steam that, with a ratio of 3.4, easily exceeded it. Other sectors with high asset turnover ratios were Social services in the market activities (2.7) and Telecommunications (2.6). At the other extreme, with asset turnover ratios below 1, were the sectors of Property activities, 0.4; Consultancy & technical activities, 0.7; Construction, 0.8 and Research and development, 0.9, all sectors that need more than a year to realise the sale of their current assets.
Finally, within the general context of a declining current asset turnover ratio, two sectors clearly stood out in the negative sense: Hospitality and Recreational and cultural activities. The former started with a ratio of 3.6 in 2019, dropping to 2.1, while the latter fell from 2.6 in 2019 to 1.4 in 2020.
Financial profitability shrank by 3.1 percentage points
Financial Profitability expresses the profit obtained by the company from its activities based on net equity. In other words, this is the company’s capacity to pay its owners or shareholders. As with economic profitability, 2020 saw a decrease of 3.1 percentage points in the case of financial profitability, which dropped to 5%.
Ratios of non-financial companies in the Basque Country by stratum and branch of activity. 2020


| | Economic return | Current asset turnover | Financial return | Total indebtedness | Debt quality | Consistency ratio | Financial leverage |
| Total | 3,2 | 1,6 | 5,0 | 0,5 | 0,6 | 2,9 | 1,9 |
| 1-9 | 3,6 | 1,2 | 5,6 | 0,4 | 0,6 | 2,9 | 1,8 |
| 10-49 | 3,6 | 1,7 | 5,7 | 0,5 | 0,5 | 2,3 | 2,0 |
| 50-249 | 2,2 | 1,7 | 3,2 | 0,5 | 0,6 | 2,7 | 2,1 |
| 250 and more | 3,0 | 2,2 | 4,6 | 0,5 | 0,5 | 3,5 | 1,9 |
| | | | | | | | |
| 02. Mining and quarrying | 0,3 | 1,0 | 0,0 | 0,3 | 0,5 | 4,0 | 1,5 |
| 03. Manufacture of food products, beverages and tobacco products | 2,8 | 1,5 | 4,7 | 0,5 | 0,7 | 3,4 | 2,0 |
| 04. Manufacture of textiles, wearing apparel and leather products | 1,4 | 1,3 | 1,8 | 0,6 | 0,6 | 1,2 | 2,6 |
| 05. Manufacture of wood and paper products, and printing | 3,4 | 1,6 | 5,6 | 0,5 | 0,6 | 2,5 | 1,9 |
| 06. Manufacture of coke and refined petroleum products | - | - | - | - | - | - | - |
| 07. Chemical industry | 8,9 | 1,6 | 16,0 | 0,5 | 0,5 | 2,0 | 1,9 |
| 08. Manufacture of pharmaceutical products | 9,3 | 1,5 | 11,9 | 0,2 | 0,5 | 5,3 | 1,3 |
| 09. Manufacture of rubber and plastic products and other non-metallic mineral products | 5,6 | 1,3 | 10,5 | 0,5 | 0,6 | 2,2 | 2,1 |
| 10. Manufacture of base metals and metal products, excluding machinery and equipment | -0,4 | 1,5 | -2,9 | 0,6 | 0,6 | 2,0 | 2,3 |
| 11. Manufacture of computer, electronic and optical products | 4,8 | 1,4 | 8,1 | 0,5 | 0,6 | 2,5 | 1,8 |
| 12. Manufacture of electrical equipment | 2,8 | 1,7 | 4,5 | 0,5 | 0,7 | 3,2 | 2,0 |
| 13. Manufacture of machinery and equipment n.e.c | 2,3 | 1,2 | 3,9 | 0,5 | 0,7 | 2,1 | 2,2 |
| 14. Manufacture of transport material | 3,1 | 1,9 | 7,3 | 0,7 | 0,6 | 1,4 | 3,2 |
| 15. Manufacture of furniture; other manufacturing industries; repair and installation of machinery and equipment | 4,7 | 1,4 | 9,8 | 0,6 | 0,7 | 1,7 | 2,3 |
| 16. Electricity, gas, steam and air conditioning supply | 5,7 | 3,4 | 8,6 | 0,4 | 0,4 | 3,9 | 1,7 |
| 17. Water supply; sewerage, waste management and remediation activities | 2,5 | 1,1 | 2,6 | 0,3 | 0,5 | 5,6 | 1,4 |
| 18. Construction | 1,8 | 0,8 | 3,0 | 0,6 | 0,7 | 1,9 | 2,4 |
| 19. Wholesale and retail trade; repair of motor vehicles and motorcycles | 4,4 | 2,1 | 8,7 | 0,6 | 0,7 | 2,1 | 2,3 |
| 20. Transportation and storage | 0,9 | 1,9 | 0,2 | 0,4 | 0,4 | 2,8 | 1,8 |
| 21. Hostelry | -7,0 | 2,1 | -26,9 | 0,7 | 0,4 | 1,6 | 3,4 |
| 22. Activities relating to publishing, audiovisual productions and radio and television programming and broadcasting | 3,1 | 1,8 | 4,9 | 0,4 | 0,7 | 4,6 | 1,7 |
| 23. Telecommunications | 4,8 | 2,6 | 8,8 | 0,7 | 0,3 | 2,0 | 3,3 |
| 24. Computer programming, consultancy and related activities; information service activities | 2,9 | 1,8 | 5,2 | 0,6 | 0,7 | 2,2 | 2,2 |
| 26. Real estate activities | 3,2 | 0,4 | 4,0 | 0,3 | 0,3 | 3,9 | 1,4 |
| 27. Legal and accounting activities; central offices; management consultancy; technical services | 6,4 | 0,7 | 8,8 | 0,3 | 0,5 | 4,6 | 1,5 |
| 28. Scientific research and development | 0,4 | 0,9 | 0,1 | 0,5 | 0,5 | 2,1 | 2,1 |
| 29. Advertising and market research; other professiona activities; veterinary activities | 4,2 | 1,0 | 5,9 | 0,4 | 0,7 | 4,4 | 1,6 |
| 30. Administrative and support service activities | 1,6 | 1,4 | 1,1 | 0,4 | 0,5 | 3,9 | 1,6 |
| 32. Market education | 1,7 | 2,2 | 2,0 | 0,4 | 0,5 | 3,0 | 1,7 |
| 33. Healthcare activities within the marketplace | 6,4 | 2,1 | 10,4 | 0,4 | 0,7 | 3,5 | 1,7 |
| 34. Market ocial work activities | 2,2 | 2,7 | 2,8 | 0,4 | 0,6 | 3,6 | 1,6 |
| 35. Arts, entertainment and recreation activities | -1,0 | 1,4 | -2,3 | 0,4 | 0,5 | 3,2 | 1,7 |
| 36. Other services | 2,0 | 2,1 | 4,5 | 0,7 | 0,6 | 2,2 | 3,2 |
Date October 25, 2022
Source: Eustat. Equity accounts of non-financial companies
Once again, medium-sized companies and micro-enterprises recorded higher profitability in 2020, with 5.7% for the former and 5.6% for the latter, while companies with fifty or more employees obtained a financial profitability of 4% in 2020. These companies recorded significant losses of 5.2 percentage points in the past year, 3.7 percentage points in the case of medium-sized companies, while losses for micro-enterprises were not as significant, at 0.7 percentage points.
For this indicator, sector-level analysis reveals highly heterogeneous situations. Thus, four sectors obtained financial profitability of over 10%. As with economic profitability, the financial profitability ranking was headed by the Chemical industry and Pharmaceutical products sectors, with 16% and 11.9%, respectively, followed by Rubber & plastics, 10.5% and Healthcare activities in the market, 10.4%. A large group including: Timber, paper & graphic arts; Computer & electronic products; Transport material; Furniture & other manufacturing industries; Electricity, gas & steam; Trade & repair of vehicles; Telecommunications; Computing; Consultancy & technical activities and Other professional activities ranged between 5% and 10% of financial profitability.
On the negative side, the Hospitality sector was once again the most affected, with a financial profitability of -26.9%, followed by Metallurgy & metal products, -2.9% and Recreational and cultural activities with -2.3%. The financial profitability of the remaining activities fluctuated between 0% in the case of Extraction industries and 4.9% for Publishing, imaging, radio and television.
Continuing the financial analysis, the Total Debt ratio of the non-financial companies in the Basque Country stood at 47.7% in 2020. This indicator links external funds to total resources and enables the financial risk of a company to be measured. Being lower than 50% indicates that less than half of the assets for non-financial companies in the Basque Country were financed with external resources. It is 1.6 percentage points more than in 2019, which breaks a series in which 10 consecutive years of decline are practically linked.
The total debt ratio was higher for medium-sized companies (49.7% in 2020), compared to large companies, with 49.1%, and micro-enterprises, with 44.9%. In 2020, micro-enterprises experienced the largest increase in total debt (3 percentage points), compared to medium-sized and large companies, with 1.3 and 0.4 percentage points more respectively.
There were also certain significant differences according to the activity sector of the company. The sectors with the highest total debt ratios and, therefore, those with the greatest dependence on external resources, all close to or over 60% were, in this order: Hospitality (70.9%); Telecommunications (69.4%); Other services (68.8%); Transport material (68.6%) and Textile, garments, leather & footwear (61.3%). At the other end of the scale, the majority of assets are fully owned in the following sectors, with a rate of under 40%: Extraction industries (33.2%); Pharmaceutical products (24%); Water supply & sanitation (26.9%); Property activities (28.2%); Consultancy & technical activities (32.5%); Other professional activities (36.4%); Social services in the market activities (38.4%) and Auxiliary services (39.4%).
In 2020, the sectors that had to assume higher debts were the Chemical industry, with an increase of 10.2 percentage points; Construction, with 8.8 more points; Telecommunications, 8.5 points and Hospitality, with an increase of 8.2 percentage points.
From a more immediate perspective, the Debt Quality Ratio correlates a company's short-term and long-terms debts. In theory, the further away the maturities (with the ratio being as small as possible), the better the debt quality. In 2020 the debt quality ratio in the Basque Country was 56.5%, 4.6 points lower than in 2019, thus showing a positive evolution. If we focus on size, medium-sized companies registered the best rates, with 52.6%, followed by large companies, with 56.7% and micro-enterprises, with 58.8%. Once again, there were significant differences depending on the type of activity. Thus, sectors considered to have high-quality debt are Property activities (31%); Telecommunications (34.3%); Transport & storage (39.1%) and Electricity, gas & steam (39.6%); while the following sectors can be found at the opposite end of the scale: Publishing, imaging, radio & television (72%) and Food, beverages & tobacco (71.6%).
Another ratio concerning the financial structure of the companies in the Basque Country is the Consistency Ratio. This is the relation between fixed assets and long-term liabilities and expresses the long-term guarantee companies offered to creditors. It stood at 286.2% in 2020, representing a decline of 41.8 percentage points compared to 2019. In terms of sectors, it fluctuated between 119.9% in the Textile, garments, leather & footwear sector and 561.6% in the Water supply & sanitation sector.
Finally, the Leverage Ratio is the company's debt ratio, that is, its total assets with respect to its net equity. This metric can be used to analyse the financial performance of a company. A high level of leverage can put its survival at risk. In 2020, the leverage ratio in the Basque Country was 191.2%, 5.8 points above that of 2019, but much lower than the limits reached at the beginning of the decade in 2010, when figures greatly exceeded 200%.
Four sectors were well in excess of a ratio of 300%; namely: Hospitality (343.4%); Telecommunications (326.6%); Other services (320.5%) and Transport material (318.3%). In fact, except for Transport material, the other aforementioned sectors experienced a strong rise in the ratio in the past year.
In 2020, the fixed assets of non-financial companies grew by 2.7%, as did non-current liabilities, by 17.7%
The analysis of the structure of assets and liabilities in the 2020 tax year provides more detailed information on non-financial companies in the Basque Country.
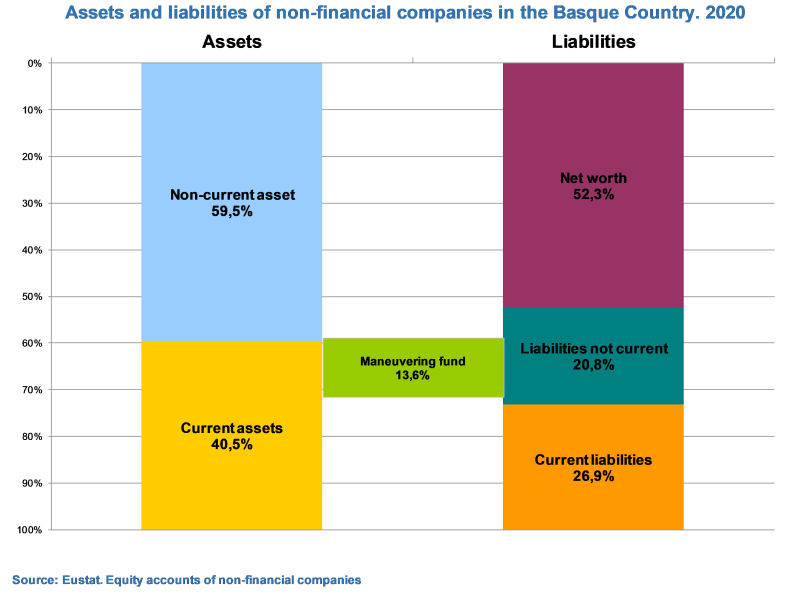
Fixed or non-current assets - resources that benefit the company in the long-term, such as intangible and tangible fixed assets, property investments and in companies belonging to the group or long-term financial investments, among others - totalled 125,887 million euros and represented 59.5% of the 211,739 million euros in total assets. In turn, current assets, with 85,852 million euros, represented the remaining 40.5%. With this evolution, fixed assets increased by 2.7% compared to 2019, while non-current or current assets remained practically unchanged in absolute values with regard to 2019. As a combination of the evolution of both assets and liabilities, total assets grew by 1.6% compared to the previous year.
In this regard, sectors with a clear dominance of fixed assets - above 75% - in 2020 were Electricity, gas & steam; Telecommunications and Property activities.
In turn, within liabilities and net equity as a whole, the share of own resources or net equity reached a total of 110,721 million euros and represented 52.3% in 2020, 1.5% lower than the figure recorded in 2019. Short-term debts or current liabilities as a whole, with a total value of 57,032 million euros, amounted to 26.9%, registering negative values of 2.8% in the past year.
However, long-term debts or non-current liabilities, standing at 43,986 million, rose by 17.7% in the past year, accounting for 20.8% as a whole. Non-current liabilities comprised long-term debts and obligations, that is, those with a maturity of over one year.
As regards sectors with a share of net equity (social capital, stocks, results...) over 65%, these include Pharmaceutical products; Water supply & sanitation; Property activities and Consultancy & technical activities.
With these results, Working Capital, the company's capacity to meet its short-term debts, which is calculated as the difference between current assets and current liabilities, was positive and valued at 28,820 million euros (13.6% of total assets), six tenths of a point higher than in 2019. This means that sufficient resources have been generated to cover specific short-term debts, and to a greater degree than in the previous year due, above all, to the drop in current liabilities in 2020.
For further information:
Eustat - Euskal Estatistika Erakundea / Basque Statistics Institute
C/ Donostia-San Sebastián, 1 01010 Vitoria-Gasteiz
Press Service: servicioprensa@eustat.eus Tel.: 945 01 75 62