Press Release 26/04/2022
INDUSTRIAL STATISTICS. 2020
The turnover figure for industry in the Basque Country fell by 18.2% in 2020
Bizkaia was hit hardest by the COVID-19 pandemic in 2020, while, in comparison, the drop was more moderate in Álava and, in particular, Gipuzkoa
In 2020, the year the COVID-19 pandemic began and when the most restrictive measures were taken, industrial activity was seriously affected, as reflected in an 18.2% reduction in turnover, according to Eustat data.
The effects of COVID-19 were felt in all economic indicators. Starting with employment, the number of people employed in industry in the Basque Country decreased by 3%, thus breaking the positive trend maintained in recent years. The total number of those employed stood at 200,699, just over six thousand fewer than in 2019, after seeing five years of continued growth.
The industrial sector, which encompasses the manufacturing industry, extraction industries, electricity, gas & steam and water supply & sanitation, carried out its activity in a total of 11,172 establishments, 1.4% less than in the previous year.
Turnover reached 49,005 million euros at current prices in 2020. This amount of income was 18.2% below that for 2019 and the lowest figure since 2005. In turn, staff expenditure fell by 5.3% compared to the previous year and the total number of hours worked was down 8.7%.
Gross value added at factor cost (GVAFC) is a macroeconomic indicator that represents the economic value of the total production of goods and services, minus the inputs necessary for that production and indirect taxes. In 2020, the gross value added generated by the industrial sector in the Basque Country stood at 13,073 million euros, 14.5% below that obtained in 2019, ending a six-year period of growth and placing this indicator at similar levels to those recorded in 2015.
Main economic indicators of the industry of the Basque Country by province (thousands €). 2020
| | Basque Country | 2020-2019 (increase %) | Araba/Álava | 2020-2019 (increase %) | Bizkaia | 2020-2019 (increase %) | Gipuzkoa | 2020-2019 (increase %) |
| Individuals employed NU | 200.699 | -3,0 | 41.647 | -2,9 | 78.754 | -3,3 | 80.298 | -2,9 |
| Turnover | 49.005.694 | -18,2 | 11.788.747 | -16,3 | 20.627.150 | -21,3 | 16.589.797 | -15,4 |
| Gross Value Added to factor costs | 13.073.105 | -14,5 | 2.884.055 | -13,4 | 4.877.746 | -17,3 | 5.311.304 | -12,4 |
| Expenditures on personnel | 8.829.580 | -5,3 | 1.835.896 | -5,8 | 3.423.202 | -5,0 | 3.570.482 | -5,3 |
| Apparent labor productivity | 65,1 | -11,8 | 69,3 | -10,8 | 61,9 | -14,5 | 66,1 | -9,8 |
| Personnel costs per person | 44,0 | -2,3 | 44,1 | -3,0 | 43,5 | -1,8 | 44,5 | -2,5 |
| Wage-adjusted labour productivity (%) | 148,1 | -9,8 | 157,1 | -8,1 | 142,5 | -13,0 | 148,8 | -7,6 |
Source: Eustat. Industrial Survey
In 2020, the Basque industrial sector registered apparent labour productivity (the output of a labour unit used in the production process) of 65,138 euros per person employed, 11.8% down on 2019, while personnel costs per person were 43,994 euros, 2.3% lower than those for the previous year. If both indicators are combined, the result is the wage-adjusted labour productivity ratio, which represents how much value added is obtained per person employed taking into account average costs. The value for 2020 was 148.5% or, in other words, in terms of value added, it was 1.48 times the value of costs per person employed. This indicator has ranged from 152.9% in 2013 to 180.9% in 2008, falling by 9.8% in 2020 compared to 2019.
In keeping with these figures, the operating income, or earnings before interest and taxes, plummeted by 47.9%. Conceptually, the operating income indicates whether a company has made a profit or loss at the end of a financial year with regard to its activity. Although significant, the drop in operating income in 2020 was similar to that recorded in 2009 (-50.9%) or, more recently, in 2013 (-51.3%).
Provincial analysis
The measures adopted in the first year of the pandemic affected all three provinces considerably, albeit to varying degrees.
Taking into account the main indicators, Bizkaia was the worst affected province and, in relative terms, Gipuzkoa coped best with the crisis.
In Bizkaia, industrial employment fell by 3.3%, compared to 2.9% in the case of Álava and Gipuzkoa; as a result, the number of hours worked were down 9% in Bizkaia, 8.7% in Álava and 8.3% in Gipuzkoa. As regards the number of industrial establishments, this figure dropped by 1.9% in Bizkaia, 1.2% in Álava and 1% in Gipuzkoa. Furthermore, staff expenditure saw a greater decrease in Álava (5.8%) than in Gipuzkoa (5.3%) and Bizkaia (5%).
The turnover figure fell significantly in all three provinces, but, once again, it was Bizkaia that saw the sharpest decline, where it was 21.3% below that for the previous year, while the drop stood at just 16.3% in Álava and 15.4% in Gipuzkoa.
Logically, the aforementioned negative results had a knock-on effect on the gross value added generated by industry in each province. Thus, the figure for 2020 was 17.3% lower than that for 2019 in Bizkaia, 13.4% lower in Álava and 12.4% lower in Gipuzkoa. Measured per person employed, apparent labour productivity revealed that, once again, Bizkaia and Gipuzkoa were the provinces at either end of the scale: in the former, the decline in productivity stood at 14.5%, while in the latter, it barely reached 10% (9.8%); Álava, in between the two, saw its average productivity fall by 10.8%.
Contrary to what occurred in the other indicators, Bizkaia was the province where costs per person employed underwent the least adjustment, with a reduction of 1.8% compared to 2.5% in Gipuzkoa and 3% in Álava. Despite this, the average cost per person in Bizkaia was the lowest out of the three provinces, standing at 43,467 euros, while in Álava it was 44,082 euros and in Gipuzkoa 44,465 euros. The comparatively lower reduction in average costs per person employed in Bizkaia did not offset the greater decline in value added. Thus, the wage-adjusted labour productivity coefficient was 142.5% of average costs in this province, whereas in Gipuzkoa it was 148.8% and in Álava it was 157.1%.
Sector-level analysis
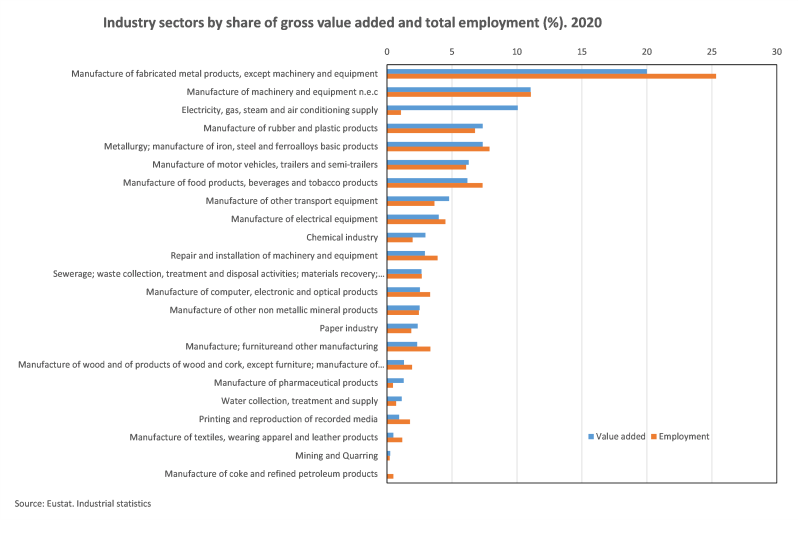
In 2020, the main sectors in the Basque Country in terms of value added were Manufacture of fabricated metal products, except machinery and equipment, Manufacture of machinery and equipment n.e.c. and Electricity, gas, steam and air conditioning supply. In all three, the value added was well in excess of one billion euros and, in the case of the first sector, even two billion euros. The Manufacture of fabricated metal products sector alone accumulated 20% of the total value added of Basque industry and these three sectors together accounted for more than 40% of the total (41.1%).
It is worth highlighting the Electricity, gas, steam and air conditioning supply sector, as it represented 10.1% of the total value added of industry with just 1.1% of the total number of people employed in this sector, while both Manufacture of fabricated metal products and Manufacture of machinery and equipment had percentages more in line with their value added, 25.3% and 11.1% of total employment.
Other sectors with significant values added, all above 6% of the industry total, were: Manufacture of rubber and plastic products (7.4%), Metallurgy, manufacture of iron, steel and ferro-alloy products (7.4%), Manufacture of motor vehicles, trailers and semi-trailers (6.3%), and Food, Beverages & Tobacco (6.2%). In all cases, their percentages of employment were in line with their respective values added, which, following the same order, were: 6.8%, 7.9%, 6.1% and 7.4%.
On the other hand, Basque industry subsectors were very diverse, as they combined activities with relatively low apparent labour productivity and average personnel costs, such as Textile, garments, leather and footwear industries, Printing and reproduction of recorded media or Manufacture of wood and of products of wood and cork, except furniture; manufacture of articles of straw and plaiting materials, with other activities that had considerably higher values for the same indicators. Sectors with these characteristics were Manufacture of other transport material, Chemical Industry, Collection, purification and distribution of water, Manufacture of Pharmaceutical Products and Electricity, gas, steam and air conditioning supply.
In 2020, apparent labour productivity within the subsectors ranged from 27,000 euros per person employed for Textile, garments, leather and footwear industries to 611,000 for Electricity, gas, steam and air conditioning supply.
Other sectors with high apparent labour productivity were Collection, purification and distribution of water and Manufacture of Pharmaceutical Products, the former with productivity in excess of 100,000 euros per person and the latter with productivity close to 200,000 euros.
In keeping with their very low apparent labour productivity, Textile, garments, leather and footwear industries (27,087 euros per person) and the Printing and reproduction of recorded media sector (34,300 euros) recorded the lowest average personnel costs, with 19,701 euros and 27,684 euros per person employed, respectively.
The average personnel cost per person was 83,033 euros per person employed for Electricity, gas, steam and air conditioning supply, the highest among the different sectors. As indicated above, this sector also registered the highest apparent labour productivity and, together with Collection, purification and distribution of water and Manufacture of Pharmaceutical Products, recorded the highest wage-adjusted labour productivity ratio with quotients of 206.1% and 303.2%, respectively, for the last two sectors and 735.7% in the case of Electricity, gas, steam and air conditioning supply.
On the other hand, the Repair and installation of machinery and equipment sector registered the lowest level of wage-adjusted labour productivity (115.1%), with the exception of the Coke Plants and Oil Refining sector, where the figure was negative.
Main economic indicators of the industry of the Basque Country by sector (A64). Thousands €. 2020


| | Individuals employed NU | Turnover | Value added | Expenditures on personnel | Apparent labor productivity | Personnel costs per person | Wage-adjusted labour productivity (%) |
| Mining and quarrying | 418 | 106.792 | 32.964 | 20.447 | 78,9 | 48,9 | 161,2 |
| Manufacture of food products, beverages and tobacco products | 14.762 | 3.877.137 | 808.531 | 486.475 | 54,8 | 33,0 | 166,2 |
| Manufacture of textiles, wearing apparel and leather products | 2.354 | 183.073 | 63.762 | 46.376 | 27,1 | 19,7 | 137,5 |
| Manufacture of wood and of products of wood and cork, except furniture; manufacture of articles of straw and plaiting materials | 3.878 | 539.307 | 170.785 | 123.151 | 44,0 | 31,8 | 138,7 |
| Manufacture of paper and paper products | 3.746 | 1.172.994 | 309.301 | 191.344 | 82,6 | 51,1 | 161,6 |
| Printing and reproduction of recorded media | 3.555 | 286.443 | 121.938 | 98.417 | 34,3 | 27,7 | 123,9 |
| Coke and refined petroleum | 990 | 3.497.321 | -99.891 | 92.825 | -100,9 | 93,8 | -107,6 |
| Chemical industry | 3.953 | 1.243.615 | 386.038 | 207.228 | 97,7 | 52,4 | 186,3 |
| Manufacture of pharmaceutical products | 932 | 344.028 | 168.555 | 55.601 | 180,9 | 59,7 | 303,2 |
| Manufacture of rubber and plastic products | 13.599 | 2.927.319 | 962.767 | 609.834 | 70,8 | 44,8 | 157,9 |
| Manufacture of other non metallic mineral products | 4.917 | 915.514 | 329.303 | 223.936 | 67,0 | 45,5 | 147,1 |
| Metallurgy, manufacture of iron, steel and ferroalloys basic products | 15.828 | 4.861.552 | 962.390 | 818.806 | 60,8 | 51,7 | 117,5 |
| Manufacture of fabricated metal products, except machinery and equipment | 50.838 | 6.849.334 | 2.614.259 | 2.088.962 | 51,4 | 41,1 | 125,1 |
| Manufacture of computer, electronic and optical products | 6.666 | 937.303 | 331.870 | 253.189 | 49,8 | 38,0 | 131,1 |
| Manufacture of electrical equipment | 9.036 | 1.762.954 | 520.404 | 398.233 | 57,6 | 44,1 | 130,7 |
| fabricacion de maquinaria y equipo n.e.c | 22.228 | 4.563.296 | 1.444.763 | 1.072.624 | 65,0 | 48,3 | 134,7 |
| Manufacture of motor vehicles, trailers and semi-trailers | 12.216 | 5.004.733 | 822.015 | 605.000 | 67,3 | 49,5 | 135,9 |
| Manufacture of other transport equipment | 7.335 | 2.509.021 | 625.435 | 452.274 | 85,3 | 61,7 | 138,3 |
| Manufacture; furnitureand other manufacturing | 6.702 | 821.231 | 304.196 | 190.889 | 45,4 | 28,5 | 159,4 |
| Repair and installation of machinery and equipment | 7.819 | 842.531 | 381.874 | 331.736 | 48,8 | 42,4 | 115,1 |
| Electricity, gas, steam and air conditioning supply | 2.154 | 4.675.803 | 1.315.834 | 178.854 | 610,9 | 83,0 | 735,7 |
| Water collection, treatment and supply | 1.412 | 290.301 | 148.275 | 71.934 | 105,0 | 50,9 | 206,1 |
| Collection and treatment of residual water; waste treatment and disposal... | 5.361 | 794.092 | 347.737 | 211.445 | 64,9 | 39,4 | 164,5 |
Source: Eustat. Industrial Survey
For further information:
Eustat - Euskal Estatistika Erakundea / Basque Statistics Institute
C/ Donostia-San Sebastián, 1 01010 Vitoria-Gasteiz
Press Service: servicioprensa@eustat.eus Tel.: 945 01 75 62