Press Release 15/12/2020
EQUITY ACCOUNTS OF NON-FINANCIAL COMPANIES 2018
The economic and financial profitability of non-financial companies in the Basque Country in 2018 was the highest in the decade
Total debt fell to 47.6%, almost ten percentage points lower than in 2010
In 2018, non-financial companies in the Basque Country had an economic profitability ratio of 4.8%, while financial profitability stood at 7.7%, according to Eustat data. Both ratios were the highest in the decade starting in 2009, when Statistics on the Equity Accounts of Non-Financial Companies were introduced.
With respect to the economic analysis of non-financial companies, the Economic Profitability ratio provides information on company’s average return on their total assets and hence the efficiency of the company’s management. High values means that less assets are required to achieve higher profits. In 2018, this ratio reached 4.8%, the highest value over the available historical series, following two years – 2016 with a value of 4.4%, and 2017 with 4.6% – that also saw the highest successive values.
Medium-sized enterprises (with 10 to 49 employees) had the most favourable profitability ratio, 5.8%, as they have for the last five available years (since 2014). In turn, for microenterprises (with 1 to 9 employees), it was 4.1%, a year-on-year growth of 0.7 percentage points, whereas for large corporations (50 or more employees) it stood at 4.8%, following a 0.3 percentage point decrease on 2017.
In 2018, the economic profitability of Healthcare Activities in the market with 9% and Rubber and Plastics with 7.9% came out on top.
Financial Profitability, on the other hand, expresses the profit obtained by the company from its activities based on net equity. In other words, it is the company’s capacity to pay its owners or shareholders. As with economic profitability, the positive trend seen in previous years continued in 2018, with the ratio reaching 7.7%, 0.2 percentage points higher than in 2017.
Medium-sized enterprises again recorded the best figures, with an average financial profitability of 9.7%, compared to 8.3% for large corporations and 6.1% for microenterprises.
The Rubber & Plastics and Healthcare Activities in the market sectors obtained the highest financial profitability ratios, with 15.2% and 14.3% respectively.
Another measure of interest in terms of economic trends for companies is the Current Asset Turnover ratio. It shows the number of times current assets have been used to generate sales, thereby quantifying the use of available resources. A high ratio denotes a good use of available resources. In 2018, the ratio was 1.8 times for non-financial companies in the Basque Country. In other words, current assets were turned over 1.8 times in a year and hence current assets were capable of generating almost two sales in a year. Furthermore, it shows a moderately positive trend, with values oscillating between a minimum of 1.5 times in 2010 and a maximum in 2018, following an increase of 0.1 percentage points on 2017.
Conversely, companies in the Electricity, Gas & Steam and the Hotel Management & Catering sectors had the highest current asset turnover, each with 3.4 times. Furthermore, the frequency of asset turnover increased with the size of the company. Thus, in the case of larger corporations, the turnover was 2.2 times its assets per year, 1.8 times for medium-sized enterprises, whereas the ratio was 1.3 times per year for microenterprises.
The analysis of the structure of assets and liabilities in the 2018 tax year provides more detailed information on non-financial companies. It should be noted from the outset that it was very similar to that of the previous financial year.
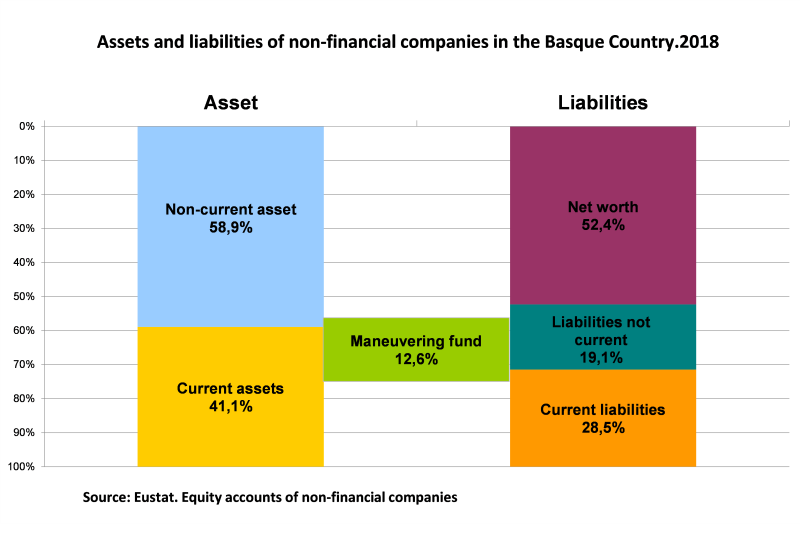
In 2018, fixed or non-current assets accounted for 58.9% of total assets, with a decrease of one percentage point on the previous tax year. There was an equivalent increase in current assets, which reached a share of 41.1% (59.9% and 40.1% of the share, respectively, in 2017).
In turn, within liabilities and net equity as a whole, the share of own resources or net equity was 52.4% in 2018, up 1.4 percentage points with respect to 2017, while within short-term debts as a whole, there was no significant variation in current liabilities – 0.2 percentage points less, with the share standing at 28.5% of total liabilities. Long-term debts or non-current liabilities saw a drop of 1.2 percentage points, standing at 19.1%.
From a broader perspective over time, net equity – principally shareholder contributions, reserves and profits – has been progressively increasing since 2010, when it was 43.5%, to the detriment of current liabilities, with 30.6% in that year, and, to a greater extent, non-current liabilities – 25.8% in 2010.
With these results, Working Capital, the company’s capacity to meet its short-term debts, which is calculated as the difference between current assets and current liabilities, was positive and valued at 25,590 million euros (12.6% of total assets), 1.2 points higher than in 2017. This means that sufficient funds have been earned to cover specific short-term debts, and to a greater degree than in the previous year.
Total debt fell to 47.6%, almost ten percentage points lower than in 2010
Continuing the financial analysis, the Total Debt ratio links external funds to total equity and stood at 47.6% for non-financial companies in the Basque Country in 2018. This ratio shows that approximately half of assets were financed with external funds and it has steadily fallen from around 60% in 2010 (56.5%).
This last year, the total debt ratio was higher for large corporations, with 50.2%, than medium-sized enterprises (49.8%) and microenterprises (43.7%).
The activity sectors with the highest debt ratios, over 60%, were, in order, Other Services (71.6%), Transport Material (67.3%), Hotel Management & Catering (63.3%) and Textile, Garments, Leather & Footwear (60.6%).
Lastly, the Consistency Ratio, a reflection of the guarantee offered by companies to long-term creditors, was 307.9% in 2018 and ranged from 165% in the Textile, Garments, Leather & Footwear sector to 541.9% in the Water Supply & Sanitation sector. It was up by 13.1 percentage points compared to the previous year for companies as a whole.
Methodological note: The population studied comprises all companies that carry on economic activities, except for those whose main activity falls within the Primary sector, the Public Administration, the Banking and Insurance sectors, and non-market services in Health, Education and Social Services and the Activities of Associations.
For further information:
Eustat - Euskal Estatistika Erakundea / Basque Statistics Institute
C/ Donostia-San Sebastián, 1 01010 Vitoria-Gasteiz
Press Service: servicioprensa@eustat.es Tel: 945 01 75 62