Press Release 24/05/2018
MUNICIPAL GDP. 2015
Industrial activities predominated in 7 of the 10 municipalities with the highest GDP per capita in the Basque Country
Zamudio, Ajangiz and Olaberria topped the ranking
Of the 10 municipalities with the highest GDP in the Basque Country, Industrial activities predominated in 7 of them, according to Eustat data. Furthermore, 4 of the 10 are in the region of Gran Bilbao. In this case, the Services sector had significant weight in the majority of these municipalities, except in the case of Zierbena, where it was clearly the industrial sector (77.4%).
The municipality of Zamudio, in the province of Bizkaia, had the highest Gross Domestic Product per capita (GDP per capita) in the Basque Country in 2015. The municipalities of Ajangiz and Olaberria occupied second and third place, respectively; the former in Bizkaia and the latter in Gipuzkoa. In Álava, Berantevilla is the municipality with the highest GDP per capita, occupying eighth place in the Basque Country.
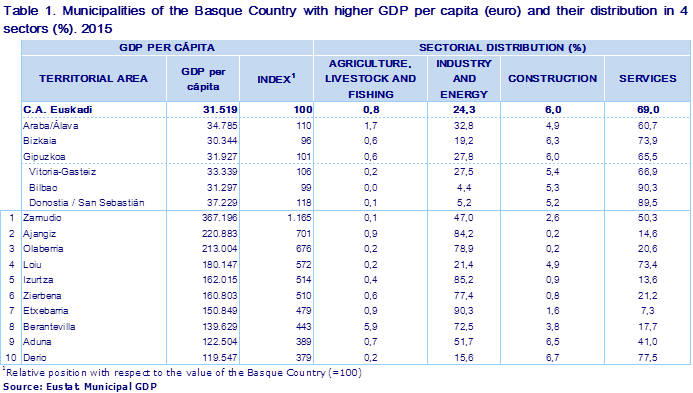
Looking at the distribution of each municipality's GDP by sectors, in Zamudio it was divided equally between the Industrial sector (47.0%), and the Services sector (50.3%), with both GDPs related to the Technology Park's business activity. The significant weight of the Industrial sector in Olaberria and Zierbena (84.2% and 78.9%, respectively) was also a notable common trait of the two municipalities. However, in Loiu, which occupied fourth place in GDP per inhabitant, unlike the previous two municipalities, it was the Services sector had a pronounced weight in the economy (73.4%).
Of the three capitals, Donostia/San Sebastián occupied first place in 2015, with a relative index position of 118 in respect of the GDP per capita of the Basque Country, that is, its GDP per capita is 18% higher than the Basque Country average. Vitoria-Gasteiz had an index of 106 and Bilbao stood slightly below the average, with an index of 99.
Around 90% of the GDP in both Bilbao and Donostia/San Sebastián was generated by the Services sector, compared with Vitoria-Gasteiz where the Services sector accounted for around 67%. In the same vein, the contribution of the Industrial sector in Vitoria-Gasteiz was notably higher (27.5%), compared to Donostia/San Sebastián (5.2%) and Bilbao (4.4%).
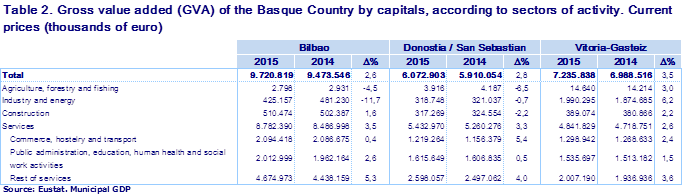
Analysing the overall performance of Gross Value Added (GVA) in the three capitals in 2015 compared to 2014, it can be observed that there was a positive variation in all three. Vitoria-Gasteiz had the highest year-on-year variation rate (3.5%), followed by Donostia/San Sebastián (2.8%) and Bilbao (2.6%). By sectors, the Services sector had the greatest weight in GVA and registered increases in the three capitals. The increase in Bilbao (3.5%) was mainly due to Other Services (5.3%), whereas the increases in Donostia/San Sebastián (3.3%) and Vitoria-Gasteiz (2.6%) were due to the sectors of Other Services and Trade, Hotel Management & Catering and Transport.
By regions, the three regions that contributed the highest values of GDP per capita were in Álava. Rioja Alavesa was in first place with an index of 179 in respect of the Basque Country average. Top of the ranking within this region are the municipalities of Laguardia, with an index of 374, Villabuena de Álaba/Eskuernaga (276) and Elciego (187). The Industrial sector (related to the wine industry) is the driving force of its economy.
The first three positions were completed by the regions of Valles Alaveses (173) and Estribaciones del Gorbea (135). The fourth and fifth positions were occupied by the region of Duranguesado (118) in Bizkaia; and Alto Deba, in Gipuzkoa, with an index of 116.
It is worth mentioning that, with the exception of Duranguesado and Alto Deba, the Industrial sector contributed a high percentage of the total value added of all these regions: around 55% on average, compared to 24.3% in the Basque Country. In contrast, the Services sector had less weight, around 35% compared to the 69.0% of the Basque Country, except for Duranguesado and Alto Deba where it stood at 55.2% and 48.1% respectively.
Graph 1. Distribution of GDP per capita by regions. Euros. 2015
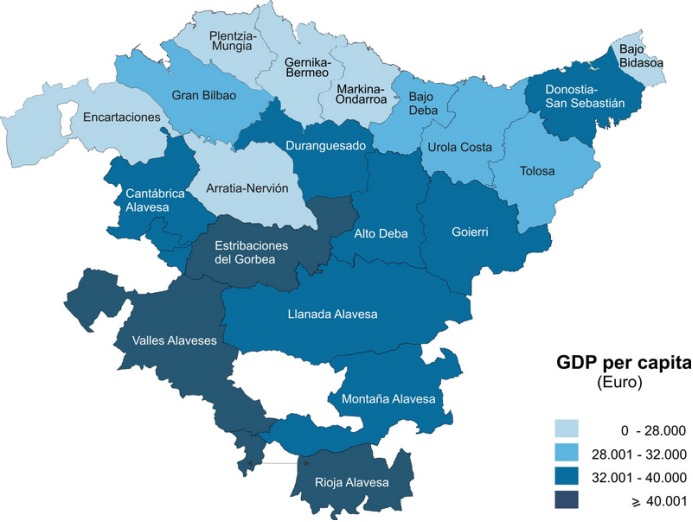
Source: Eustat. MUNICIPAL GDP
�
Methodological note:
In this new publication of municipal GDP in the Basque Country referring to the year 2015, Eustat has effected, as it has done every five years, a base change (base 2015), which has meant carrying out the estimate under the methodological framework defined in the new base year. The base change means an exhaustive revision of the information sources and the estimation methods, as this is the time to incorporate those changes that result in an improvement in estimates.
Likewise, the criteria established in the European System of Accounts (ESA 2010) are maintained.
From the diffusion of the Municipal GDP 2015, in base 2015, this will be yearly statistical operation. Furthermore, the information referring to the year 2014 is available in the databank. The previous historical series (years 1996, 2000, 2005, 2008, 2010 and 2012) updated in base 2015 will be published in due course.
When interpreting these data one must distinguish between municipal GDP and municipal income; GDP is connected to production, to wealth generation, and is concentrated in municipalities with important productive establishments. Income, on the other hand, is related to individuals and their property.
For further information:
Eustat - Euskal Estatistika Erakundea / Basque Statistics Institute
C/ Donostia-San Sebastián, 1 01010 Vitoria-Gasteiz
Press Service: servicioprensa@eustat.eus Tel: 945 01 75 62