Press Release 30/12/2016
INNOVATION SURVEY. 2015
The percentage of innovating companies in the Basque grew to 16.9% in 2015
67% of companies with technological innovation receiving public funding received it from the Basque Government
The percentage of companies in the Basque Country carrying out innovation – technological or otherwise – in 2015 was 16.9%, 0.4 percentage points more than in 2014, according to Eustat data. Taking into account companies with 10 or more employees only, the percentage of innovating companies was 34.6%, 0.1 percentage points more than in 2014.
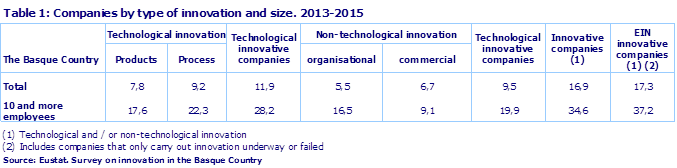
The number of companies with technological innovation in the 2013-2015 period represented 11.9% of the total, which is equivalent to 19,338 companies in the Basque Country, which was a drop of 0.3 percentage points in relation to the previous period. Technological innovation is considered to be innovation carried out by companies that are able to introduce a new or appreciably improved product into the market, be it goods or services related (7.8% of the total in 2015), or those which implement, within their own establishment, a new or appreciably improved process, (9.2% of the total).
These percentages, however, rise to 28.2% if only companies with 10 or more employees are taken into account, an increase of 0.7 percentage points on the data from the previous year. In this size of company, 17.6% were product innovators and 22.3% process innovators.
Expenditure invested by Basque companies in technological innovation activities accounted for 3.5% of GDP
Spending implemented by Basque companies on technological innovation activities stood at 2,443.2 million euros in 2015, a figure lower than that of the previous year by 1.2%. This expenditure represented 3.5% of GDP.
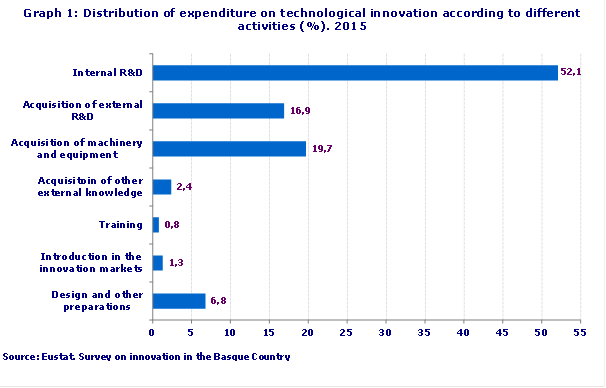
Amongst the main activities necessary for technological innovation, particular mention should be made of spending on internal R&D, which accounted for 52.1% of total expenditure, the Acquisition of Machinery and Equipment, 19.7%, and the Acquisition of External R&D, 16.9%, with the remaining activities accounting for 11.3% of spending.
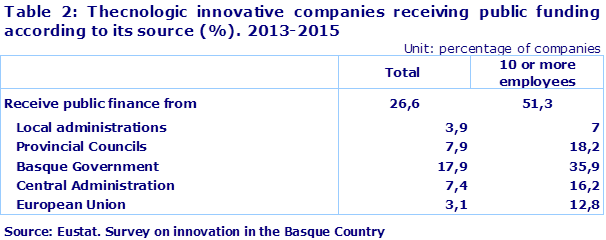
26.6% of companies with technological innovation received public funding
If we look at where these grants came from, it is worth mentioning that the Basque Government provided 17.9% of the total for these companies. This means that, of the total number of innovating companies that receive grants, 67.3% receive them from the Basque Government. In the case of companies of 10 or more employees, 51.3% received grants, with the Basque Government being the provider of funds to 35.9%, the greatest number of companies of this size that spent on innovation. To put it another way, of the total number of companies with 10 or more employees that receive grants, 70% receive them from the Basque Government.
Almost all, 91.7%, of companies with technological innovation believe that innovation had positive effects
84.4% thought that innovation had positive effects on their products (goods or services), 71.4% on their internal processes, 54.3% on employment and 46.0% believed that there were other positive effects, such as a lesser impact on the environment or an improvement in the health of their employees.
In innovating companies of 10 or more employees, 93.3% felt that innovation had positive effects, whilst the rest of the previously mentioned percentages regarding this size of company accounted for 83.9%, 69.3%, 60.7% and 46.0%, respectively.
Just over half of companies felt that there were factors that hindered technological innovation
Specifically, 57.0% believed that certain factors existed that made technological innovation difficult. Amongst these factors, the economic ones stand out. These companies highlighted economic risks, which they considered excessive (41.1%), increased costs involved in carrying out innovation (44.8%) and the lack of funding sources (37.6%). Amongst companies with 10 or more employees, the percentage of those that thought there were factors that made innovation difficult rose to 66.1%, with the same hindrances highlighted.
Non-technological innovation
9.5% of companies engaged in non-technological innovation, which includes organisational innovation or innovation related to marketing. Organisational innovation consists of the implementation of new organisational methods in the internal functioning of the company, and was carried out by 5.5% of Basque companies, whilst marketing innovation is the implementation of new commercial strategies or concepts that are significantly different to previous ones and that have not been used before, which was the case in 6.7% of all companies in the Basque Country. Non-technological innovation stood at 19.9% in companies with 10 or more employees, and was obtained by carrying out organisational innovation, 16.5%, and marketing innovation, 9.1%.
For further information:
Eustat - Euskal Estatistika Erakundea / Basque Statistics Institute
C/ Donostia-San Sebastián, 1 01010 Vitoria-Gasteiz
Press Service: servicioprensa@eustat.es Tel: 945 01 75 62
Further press releases on the Survey on Innovation of the Basque Country
Databank on the Survey on Innovation of the Basque Country