Press Release 10/06/2015
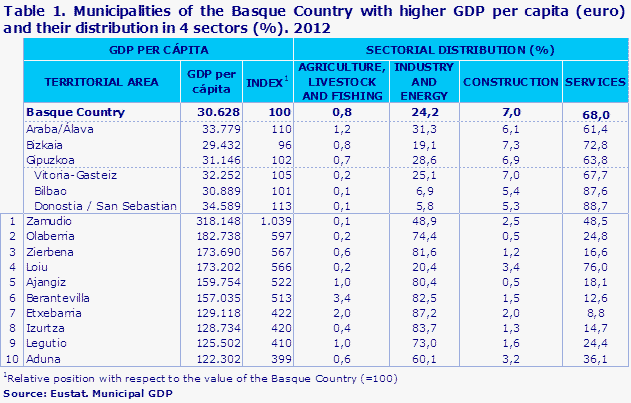
Zamudio, Olaberria and Zierbena were the municipalities that generated the greatest wealth per capita in the Basque Country
Industrial activities predominated in the municipalities with the greatest GDP per capita, except for in Loiu where the services sector amounted to 76%
The municipality of Zamudio, in the province of Bizkaia, had the highest Gross Domestic Product per capita in the Basque Country in 2012, according to data published byEUSTAT. The municipalities of Olaberria and Zierbena occupied second and third place, respectively; the former in Gipuzkoa and the latter in Bizkaia. The municipalities of Loiu and Ajangiz, both in Bizkaia, were in fourth and fifth place, and the municipality of Berantevilla, in Álava, occupied sixth place.
Of the three capitals, Donostia/San Sebastián occupied first place in 2012, with an index of 113, followed by Vitoria-Gasteiz (105) and Bilbao, with a slightly higher than average index (101).
Looking at the distribution of each municipality's GDP by sectors, it becomes apparent that Zamudio's GDP was divided equally between the industrial sector (48.9%), and the services sector (48.5%), with both GDPs related to the Technology Park's business activity. A common characteristic of the three municipalities with the highest GDP was the scant importance of the primary sector. The high industrial weight of Olaberria and Zierbena (74.4% and 81.6%, respectively) is also a notably common trait of the two municipalities. The weight of the services sector was relatively low in both municipalities, 24.8% and 16.6% respectively. However, it should also be pointed out that in Loiu, which occupied fourth place in GDP per inhabitant, the services sector had a significant weight in the economy (76.0%), unlike the former three municipalities.
With regards to the three capitals, more than 85% of the GDP of Bilbao and Donostia/San Sebastián was generated by the services sector, as opposed to Vitoria-Gasteiz, where the percentage was around 68%. In the same vein, the contribution of the industrial sector in Vitoria-Gasteiz was higher (25.1%), compared to Bilbao (6.9%) and Donostia/San Sebastián (5.8%).
By regions, the three regions that contributed the highest values of GDP per capita were in Álava, where Valles Alaveses was in first place with an index of 181. This region includes the municipalities of Berantevilla, with an index of 513, Zambrana (257) and Lantarón (249) which topped the ranking. In the case of Berantevilla and Lantarón the economy was driven by the industrial sector, whilst in Zambrana it was the services sector.
The first three positions were occupied by the regions of Rioja Alavesa (173) and Estribaciones del Gorbea (136). The fourth and fifth positions were occupied by the region of Alto Deba (125) in Gipuzkoa; and another Álava region, Montaña Alavesa, with an index of 117.
It bears mentioning that, with the exception of Montaña Alavesa, the industrial sector contributed a high percentage of the total added value of all these regions: around 50% on average, compared to 24.2% in the Basque Country. To the contrary, the services sector had less weight (around 40%), as opposed to 68.0% in the Basque Country.
With regards to the evolution of GDP per capita in 2010-2012, 133 of the 251 municipalities in the Basque Country (53%) revealed a negative trend, with 118 performing positively.
On a positive note, the municipalities of Zerain, Gaztelu and Alonsotegi presented the highest growth, with increases in 2010-2012 of 52.0%, 50.5% and 47.4%, respectively.
Of the municipalities with more than 20,000 inhabitants, those that stood out the most were Santurtzi (9.9%), Irún (3.7%) and Errenteria (2.9%) on the positive side; and Sestao (-15.4%), Galdakao(-11.6%) and Leioa (-9.8%), for their negative variations.
Of the three capitals, Donostia/San Sebastián registered the most negative trend, with a -1.4% drop in GDP per capita, followed by Vitoria-Gasteiz with -0.1%. Bilbao, however, was the only one of the three capitals that posted a positive performance (0.3%).
�
Graph 1. Distribution of GDP per capita by regions 2012. Euros
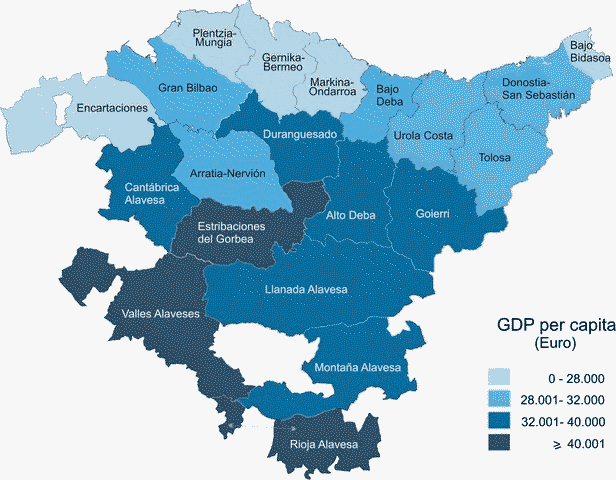
Source: Eustat. Municipal GDP
Methodological note:
This new publication of municipal GDP has required the adoption of the criteria established in the European System of Accounts (ESA 2010).
When interpreting these data one must distinguish between municipal GDP and municipal income; GDP is connected to production, to wealth generation, and is concentrated in municipalities with important productive establishments. Income, on the other hand, is related to individuals and their property.
For further information:
Eustat - Euskal Estatistika Erakundea / Instituto Vasco de Estadística
C/ Donostia-San Sebastián, 1 01010 Vitoria-Gasteiz
Press Service: servicioprensa@eustat.eus Tlf: 945 01 75 62
Further press releases on the Basque Country's municipal GDP
Databank on the Basque Country's municipal GDP