Press Release 29/11/2013
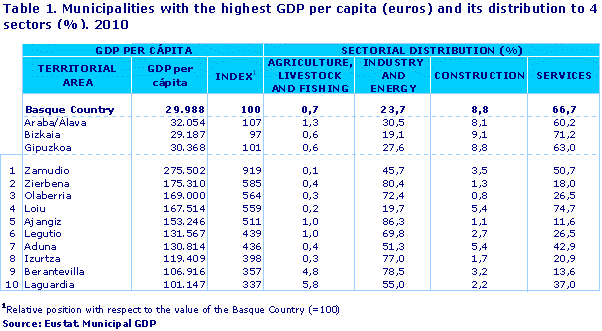
The municipalities of Zamudio, Zierbena and Olaberria had the highest GDP per capita of the Basque Country
By regions, Rioja Alavesa, Valles Alaveses and Estribaciones del Gorbea, in Álava, showed the highest GDP values per inhabitant
The municipality of Zamudio, in the province of Bizkaia, revealed the highest Gross Domestic Product per capita in the Basque Country in 2010, according to data published by EUSTAT. The municipalities of Zierbena and Olaberria occupied second and third place, respectively; the former in Bizkaia and the latter in Gipuzkoa. The municipalities of Loiu and Ajangiz, in Bizkaia, were in fourth and fifth place, and the municipality of Legutio, in Álava, occupied sixth place.
In terms of provinces, Álava was the province with the highest GDP per capita, with an index of 107 against the Basque Country average (100). It was followed by Gipuzkoa (101), which was very close to the average, and Bizkaia in the last position, with an index of 97.
Of the three capitals, Donostia/San Sebastián occupied first place in 2010, with an index of 108, followed by Vitoria-Gasteiz (102) and Bilbao, with a lower than average index (97).
Observing the distribution of each municipality's GDP by sectors, Zamudio's GDP was mainly in the services sector (50.7%), followed by the industrial sector (45.7%). Both GDPs were related to the Technology Park's business activity. A common characteristic of the three municipalities with the highest GDP was the scant importance of the primary sector. The high industrial weight of Zierbena and Olaberria (80.4% and 72.4%, respectively) should be pointed out as a common trait of the two municipalities. The weight of the services sector was relatively low (18% and 26.5%, respectively) in both municipalities.
With regards to the three capitals, it is worth mentioning that more than 85% of the GDP of Bilbao and Donostia/San Sebastián was generated by the services sector, as opposed to Vitoria-Gasteiz, where the percentage was around 65%. In the same vein, the contribution of the industrial sector in Vitoria-Gasteiz was higher (24.1%), compared to Bilbao (5.4%) and Donostia/San Sebastián (5.7%).
By regions, the three regions that contributed the highest values of GDP per capita were in Álava, where Rioja Alavesa was in first place, with an index of 172 based on the strong presence of the wine industry and a low population density. The municipalities of Laguardia (337), Villabuena de Álava/Eskuernaga (200) and Elciego (188) were the leaders of the good results in Rioja Alavesa.
The first three positions were completed by the regions of Valles Alaveses (160) and Estribaciones del Gorbea (146). The fourth and fifth positions were occupied by the region of Alto Deba (127) in Gipuzkoa; and another Álava region, Montaña Alavesa, with an index of 123.
It bears mentioning that, with the exception of Montaña Alavesa, the industrial sector contributed a high percentage of the total added value of all these regions: around 50% on average, compared to 23.7% in the Basque Country. To the contrary, the services sector had less weight (around 40%), as opposed to 66.7% in the Basque Country.
With regards to the evolution of GDP per capita in 2008-2010, 177 of the 251 municipalities in the Basque Country (71%) revealed a negative trend. In addition, 148 (5.9%) showed a worse trend than the average for the Basque Country, which posted a 2.1% drop in the accumulative annual average variation. On a positive note, the municipalities of Lanestosa, Orozko and Sukarrieta presented the highest growth, with increases of 46.4%, 31.0% and 21.2%, respectively. Of the municipalities with more than 20,000 inhabitants, those that stood out the most were Durango (8.8%), Leioa (5.9%), Santurzi (3.9%) and Erandio (3.6%) on the positive side; and Errentia (-6%), Barakaldo(-5.2%) and Sestao (-3.5%), for their negative variations. Of the three capitals, Vitoria-Gasteiz registered the most negative trend, with an accumulative annual average variation of a -4.1% in GDP per capita, followed by Bilbao with -0.5%. Donostia/San Sebastián, however, registered 0.3% growth, which placed it in the lead position of the three capitals in 2010, taking over from Vitoria-Gasteiz.
�
Graphic 1: Distribution of GDP per capita by regions 2010. Euros
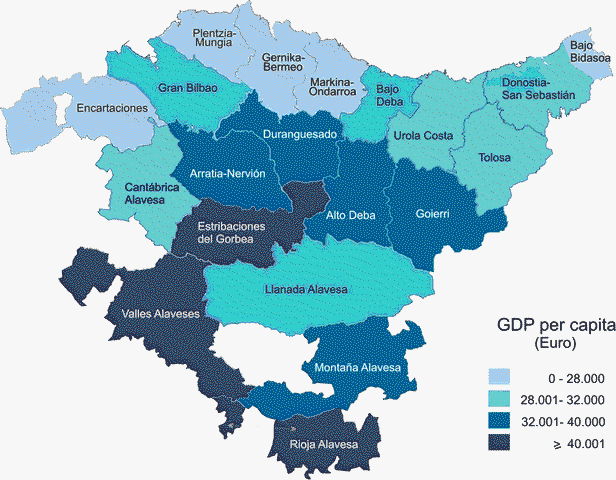
Source: Eustat. MUNICIPAL GDP
Methodological note:
This new edition of municipal GDP implies the adoption of two substantial changes compared to previously published data.
Firstly, as opposed to publications in previous years, the classification by sectors used to estimate the two years is based on the National Classification of Economic Activities (CNAE-2009).
Secondly, the base year and the year of reference is 2010 for both the 2008 data and 2010 data. The variable for occupation used was "Job Posts", which allowed for a full comparison of the two years.
For further information:
Eustat - Euskal Estatistika Erakundea / Instituto Vasco de Estadística
C/ Donostia-San Sebastián, 1 01010 Vitoria-Gasteiz
Press Service: servicioprensa@eustat.eus Tlf: 945 01 75 62
Further press releases on the Basque Country's municipal GDP
Databank on the Basque Country's municipal GDP