Press release 12/13/2012
30.7% of Basque companies with 10 or more employees implemented technological innovation in 2011
This percentage rises to 37.8% if non-technological innovation is also taken into account
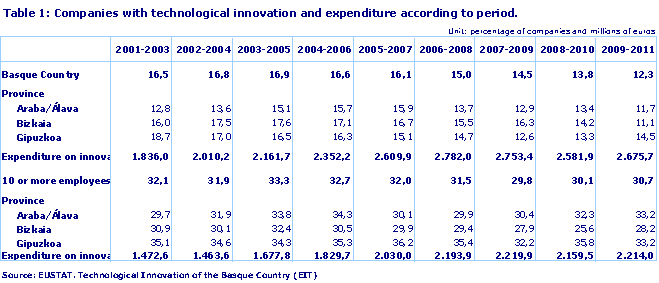
The percentage of companies with technological innovation in 2011 was 12.3%, rising to 30.7% in those with 10 or more employees, according to Eustat data. Spending implemented by Basque companies on technological innovation activities stood at 2,675.7 million euros, following a drop of 3.6% with regards to the previous year. This spending represented 4.04% of GDP.
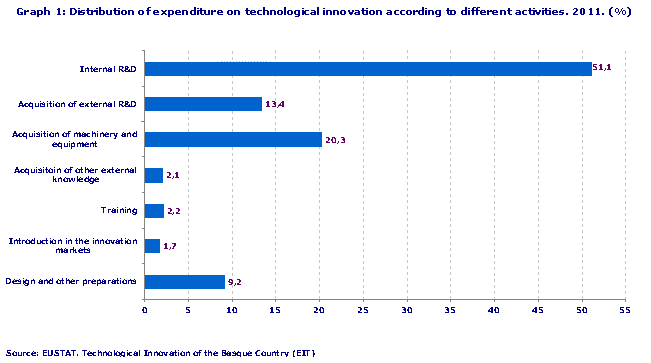
Amongst the main activities necessary for technological innovation, particular mention should be made of spending on internal R&D, which accounted for 51.1% of the total, the acquisition of machinery and equipment, 20.3%, and the acquisition of external R&D, 13.4%, with the remaining activities accounting for 15.2% of expenditure.
The number of companies with technological innovation in the 2009-2011 period represented 12.3% of the total in the Basque Country, which was a drop of 1.5 percentage points in relation to the previous period. This percentage was equivalent to 21,417 companies. Technological innovation is considered to be innovation carried out by companies that are able to introduce a new or appreciably improved product into the market, be it goods or services related (6.4% of the total in 2011), or those which implement, within their own establishment, a new or appreciably improved process, (10.6% of the total).
These percentages, however, rise to 30.7% if only companies with 10 or more employees are taken into account, which is an improvement of six tenths on the data from the previous year. In this size of company, 19.8% were product innovators and 23.1% process innovators.
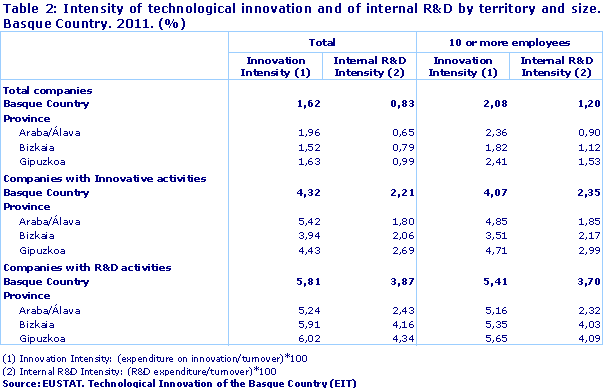
Innovation intensity, defined as spending on innovation activities as a percentage of turnover, stood at 1.62%, whilst internal R&D intensity, spending on internal R&D as a percentage of turnover, stood at 0.83%. If we take into account companies of 10 or more employees, these percentages rise to 2.08% and 1.20%, respectively.
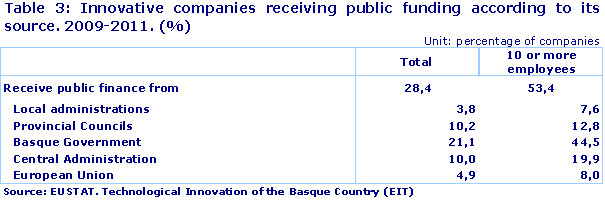
�28.4% of companies with technological innovation received public funding
If we look at where this support came from, it is worth mentioning that the Basque Government provided 21.1% of the total for these companies. In the case of companies of 10 or more employees, 53.4% received support, with the Basque Government being the provider of funds to the greatest number of companies, specifically 44.5% of companies of this size that spent on innovation.
Regarding cooperation on activities relating to R&D and innovation, 12.5% of innovating establishments signed some kind of agreement with other companies or institutions in the 2009-2011 period. This percentage rose to 29.6% in establishments with 10 or more employees.
In this employment-size class, amongst those that signed some sort of agreement particular mention should be made of cooperation with Technology centres (65.6%), with Other establishments within the same company (59.8%), with Universities and other higher education institutes (54.2%), with Providers of equipment, materials, etc. (53.5%) and with Customers (51.4%).
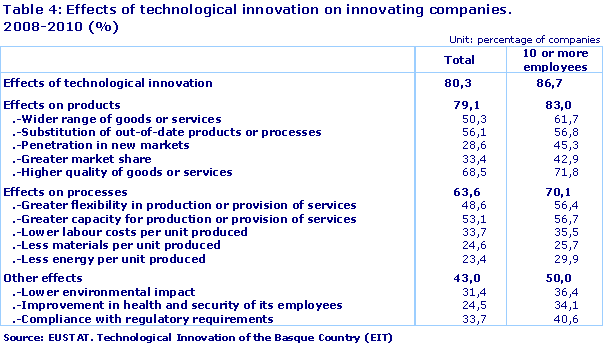
80.3% of innovating companies felt that innovation had positive effects
79.1% thought that innovation had positive effects on their products (goods or services), 63.6%, on their internal processes and 43.0% believed that there were other positive effects, such as a lesser impact on the environment or an improvement in the health of their employees.
In innovating companies of 10 or more employees, 86.7% felt that innovation had positive effects, whilst the rest of the previously mentioned percentages regarding this size of company accounted for 83.0%, 70.1% and 50.0%, respectively.
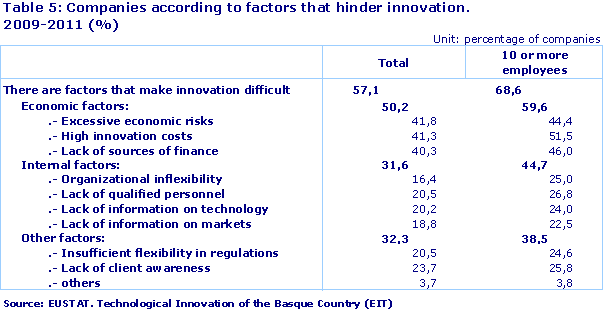
Just over half of companies felt that there were factors that hindered technological innovation
Specifically, 57.1% considered that determined factors existed that made technological innovation difficult. Amongst these factors, the economic ones stand out. These companies highlighted economic risks, which they considered excessive (41.8%), increased costs involved in carrying out innovation (41.3%) and the lack of funding sources (40.3%). Amongst companies with 10 or more employees, the percentage of those that thought there were factors that made innovation difficult rose to 68.6%, with the same hindrances highlighted.
�27.2% of innovating companies with 10 or more employees used some kind of patent or other methods of protection for their inventions or innovations
It is worth mentioning that during the 2009-2011 period, 27.2% of innovating companies with 10 or more employees used some kind of patent or other method of protection. In these companies during this period, 10.3% applied for a patent to protect inventions or innovations developed in their establishments and 13.8% had one that was active at the end of 2011. Regarding other methods of protection, 21.6% of innovating companies of 10 or more employees used one in the cited period. Amongst these the registering of trademarks (19.2%), and of designs or models (11.3%), were particularly noteworthy.
37.8% of companies of 10 or more employees implemented innovation (technological or non-technological) in the Basque Country in the 2009-2011 period
On the other hand, if we also take into account non-technological innovation in the Basque Country, 17.8% of companies were innovators (technological or non-technological innovation) in the 2009-2011 period. This percentage was obtained by taking into account non-technological innovation (10.7% of companies) as well as technological innovation (12.3% of companies). If only companies of 10 or more employees are considered, the percentage of innovating companies (technological or non-technological) stood at 37.8%.
Non-technological innovation is composed of organisational innovation or innovation related to marketing.
Organisational innovation consists of the implementation of new organisational methods in the internal functioning of the company, and was carried out by 7.4% of Basque companies, whilst marketing innovation is the implementation of new commercial strategies or concepts that are significantly different to previous ones and that have not been used before, which was the case in 6.7% of all companies in the Basque Country.
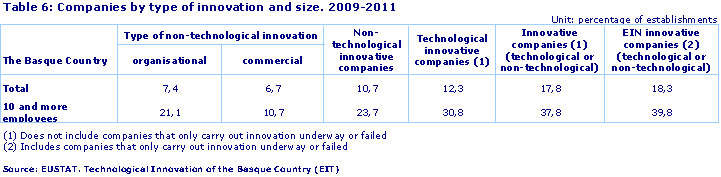
As regards companies with 10 or more employees, those that implement innovation of any kind represented 37.8% in this period.
This figure was reached taking into account the fact that 30.7% of these companies implemented technological innovation and 23.7% non-technological innovation.
The figure for non-technological innovation, for its part, and for this size of company, was obtained from 21.1% implementing organisational innovation and 10.7% marketing innovation.
It can added that, if we also consider companies that solely had innovation in progress or innovation that was unsuccessful, the so-called EIN companies, the percentage of those with 10 or more employees that implemented innovation accounted for 39.8%.
Methodological note: The Survey on Technological Innovation EIT 2009 includes the National Classification of Economic Activities 2009 (CNAE-2009).
For further information:
Basque Statistics Office
C/ Donostia-San Sebastián, 1 01010 Vitoria-Gasteiz
Tlf:+34-945-01 75 00 Fax:+34-945-01 75 01 E-mail: eustat@eustat.eus
Contact: José Miguel Escalada
Tlf:+34-945-01 75 96 Fax:+34-945-01 75 01
Further press releases on the Technological Innovation of the Basque Country (EIT) Survey
Databank on the Technological Innovation of the Basque Country (EIT)Survey