Press release 31/10/2011
The largest companies were most capital intensive in 2009
Micro-companies held 42.2% of business equity and accounted for 43.6% of the total number of employed people
Companies of more than 250 employees were the most capital intensive in 2009, given that they accounted for 21.9% of the total assets of the economy with 12.1% of employment in that year, according to Eustat data. The remainder, accounting for 87.9% of employed people, held 78.1% of the assets. Within the small bracket, companies of between 1 and 9 employees held 42.2% of business equity and accounted for 43.6% of employed people.
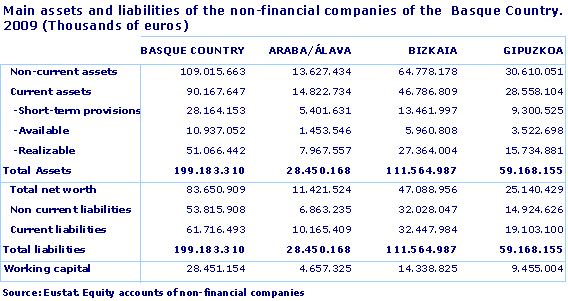
Predicted equity for non-financial companies in the Basque Country as a whole in 2009 stood at 199,183 million euros, 43.2% of which belonged to the services sector. The remaining assets were distributed amongst the industrial sector (40.4%), and the construction sector (16.4%).
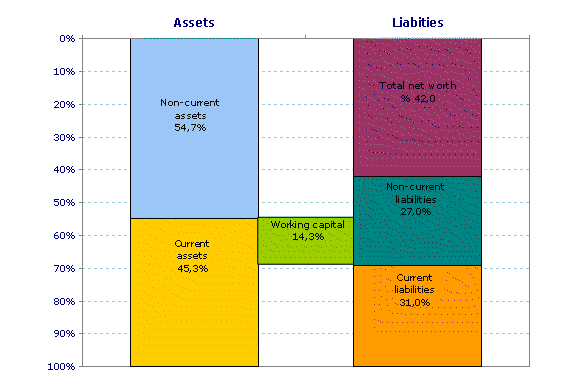
Assets and Liabilities of non-financial companies of the Basque Country. 2009
Source: Eustat. Equity accounts of non-financial companies (CPENF)
As regards the weight of the different entries under Assets of the balance sheet, Fixed Assets accounted for 54.7% of the total whilst Current Assets stood at 45.3%. Under the headings that make up Fixed Assets, most notable in terms of importance were Tangible Fixed Assets (43.0%) and Investments in Group Companies and Affiliates (36.1%). There were also two items that stood out under Current Assets: Trade Debtors, which accounted for 35.1% of the total, and Stock, with 31.2%.
With regards to Net Equity and Liabilities on the balance sheet, the share of its headings was as follows: Net Equity, which accounted for 42.0% of the total, Current Liabilities, with 24.4%, and Non-Current Liabilities, which accounted for 27.0%. With Net Equity, special mention should be made of Own Funds with two important headings: Reserves (49.9%) and Capital (32.5%).
In the distribution of assets by sectors, the importance of industry was made clear within the economy of the Basque Country. Thus, 40.3% of assets corresponded to the industrial sector, which generated 28.1% of employment, although it was market services that generated the greatest percentages, with 43.2% of equity and 60.1% of employment. Lastly, construction had 16.5% of assets and 11.8% of employment.
Differences can also be seen in the composition of company liabilities in the construction sector compared to those of industry and market services. The construction sector had Current Liabilities, associated with the short term, of 39.2%, whilst in the industrial sector they stood at 29.6% and in market services at 29.2%.
The Financial Autonomy ratio, which measures the financial dependency of companies on third parties (understood as the relation between net assets and other liabilities), stood at 72.4%. This autonomy was less prevalent in the construction sector, which had a ratio of 46.3%, with the industry and services sectors standing at 72.9% and 84.4%, respectively.
Differences were also seen in the composition of business assets by sectors. Thus, current assets in the construction sector accounted for 73.8% of total assets, whereas they accounted for 40.1% in the industrial sector and 39.3% in the market services sector.
In the analysis of the balance sheets, the Working Capital (difference between Current Assets and Current Liabilities) was positive, standing at 28,451 million euros, which meant that sufficient resources were generated to address short-term debts (due in the short term). However, as a result of the different balance sheet structures by business sectors, the working capital of companies in the construction sector accounted for 34.6% of its assets, whilst the figure stood at 10.5% for the industrial sector and 10.1% for the market services sector.
The Basic financial profitability offers information relating to the average profit made by the company during its activity, in relation to its net assets and non current liabilities, and stood at 3.2%. In the construction sector this ratio stood at 1.7% and in the market services sector it stood at 4.1%. In the industrial sector it stood at 2.7%.
For further information:
Basque Statistics Office
C/ Donostia-San Sebastián, 1 01010 Vitoria-Gasteiz
Tel: +34-945-01 75 00 Fax:+34-945-01 75 01 E-mail: eustat@eustat.eus
Contact: Patxi Garrido
Tel:+34-945-01 75 13 Fax:+34-945-01 75 01
More press releases on CPENF – Equity Accounts of Non-Financial Companies
Databank on Equity Accounts of Non-Financial Companies