Press release 30/03/2010
The European Innovation Scoreboard EIS 2009 ranks the Basque Country over the European average
The The Basque Country is on a par with the group of high innovation countries
The new European Innovation Scoreboard EIS 2009 reached a value of 0.51 in the Basque Country in 2009, according to Eustat data, meaning that it stood at 10th place in the European Union-27 and above its average, which was 0.48
The EU-27 countries, according to the rating achieved, can be grouped into four categories. The first, innovation leader countries, included Sweden (0.64), Finland (0.62), Germany (0.60), United Kingdom (0.58) and Denmark (0.57), although the European country at the forefront of innovation in Europe, Switzerland (0.69), does not belong to the European Union.
The second group, innovation followers, included the Basque Country and also comprised Austria, Luxembourg, Belgium, Ireland, France, the Netherlands, Estonia, Cyprus and Slovenia, with ratings above the European average, between 0.54 and 0.47.
Next came the third group, moderate innovators, which included the Czech Republic, Portugal, Spain, Greece, Italy, Malta, Slovakia, Hungary, Poland and Lithuania. . Finally, in the fourth group, Romania, Lithuania and Bulgaria were the catching-up countries.
Graph 1. European Innovation Scoreboard EIS 2009. Basque Country and the EU-27
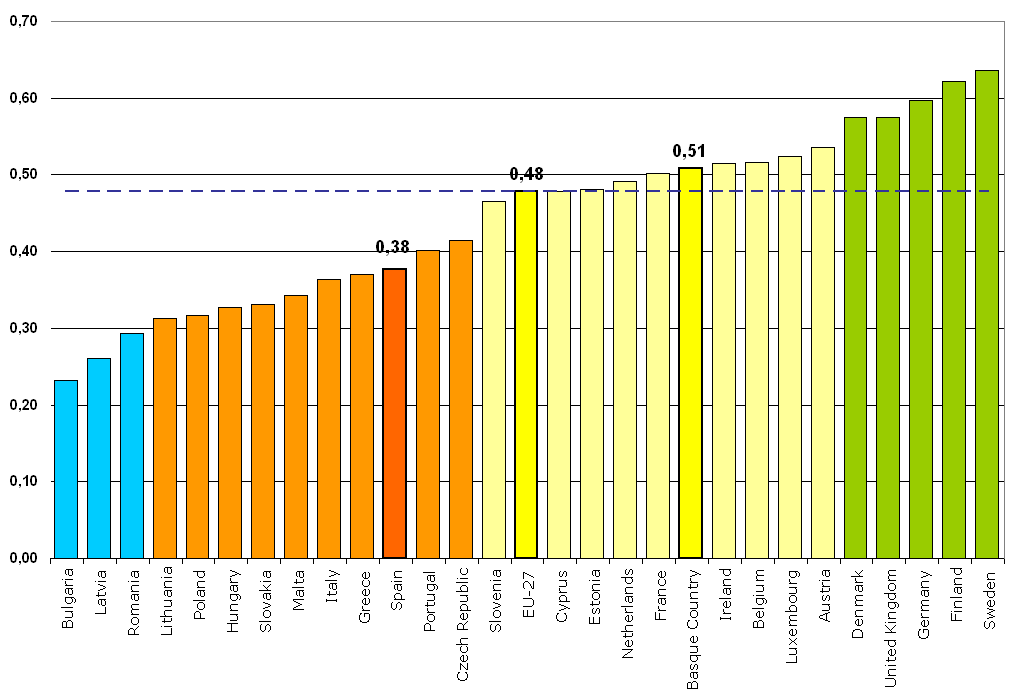
Source: Eustat and PRO INNO Europe: INNO-Metrics. European Commission
Human Resources, Linkages and Entrepreneurship and Economic Effects are the three basic dimensions of Basque innovation
The European Innovation Scoreboard, which sets out to measure the degree to which economies of countries have the capacity for and develop innovation activities, is structured in seven dimensions, giving a total of 29 indicators.
Table 1. European Innovation Scoreboard EIS 2009 and its dimensions indices
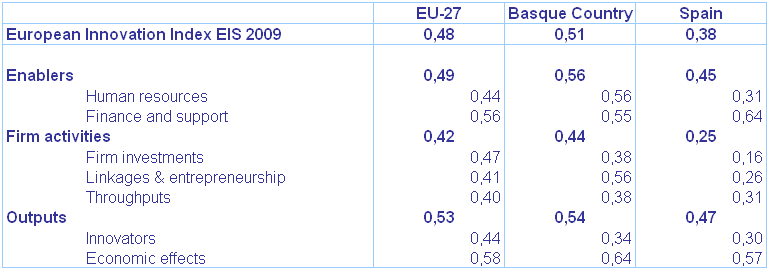
Source: Eustat and PRO INNO Europe: INNO-Metrics. European Commission
The Basque Country, with regard to the European average, is notable in three of these dimensions, Human Resources, Linkages and Entrepreneurship and Economic Effects. In the other dimensions, the score obtained by the Community is lower than that achieved in the European Union.
In Human Resources, the dimension that records the availability of highly qualified and educated people as a key factor in innovation, the Basque Country stood out for several of its indicators:
· 46.7 per thousand young people aged 20 to 29 were graduates of Science and Engineering and Social Sciences and Humanities, whereas the European rate came to 40.5 per thousand.
· The percentage of the population with higher education (University or Higher Grade Vocational Training) aged 25 to 64 came to 42.2%; almost double the community average, 24.3%.
· 13.5% of the population aged 25 to 64 participated in lifelong learning activities, whereas in Europe, this represented 9.6%.
· The population aged 20 to 24 which had at least completed secondary education, 78.0%, was slightly above the European average, 78.5%.
The Linkages and Entrepreneurship dimension underlined the efforts made by business regarding collaboration and the importance of cooperation, both between innovative companies and with the public sector. Here the percentage of firm renewal, 12.4%, compared to 5.1% obtained in Europe was outstanding, while the percentage of Innovative SMEs collaborating in innovation was somewhat lower, 8.2% in the Community compared to the European average of 9.4%.
As for Economic Effects, the dimension that brings together the economic success that innovation activities have on employment, exports and sales, the following were of note:
Personnel employed in knowledge-intensive service sectors represented 19.0% of total employment, compared to 14.9% in Europe.
Employment in medium-high & high-tech manufacturing sectors accounted for 7.7% of the total compared to the community average of 6.6%.
Medium and high-tech exports represented 51.5% of total exports, meaning 4.1 percentage points than the European Union, 47.4%.
The economic impact on turnover by product innovations represented 15.4% in the Basque Country compared to the European average of 14.9%.
Although for other dimensions, the score achieved was lower than the European average, here we can also highlight several indicators where the Basque Country obtained similar or indeed better results in comparison with the European Union. For example, in the Basque Country the percentage of companies with 10 or more employees with access to broadband was higher, 92.0%, to that obtained in Europe, 81.0%.
The percentage of GDP dedicated to Venture Capital came to 0.18% in the case of the Basque Country, while the European average was 0.14%.
SMEs that have developed technological innovation came to 30.5% compared to 33.7% in the EU.
Resource efficiency due to innovation meant that 19.6% of innovative companies reduced labour costs and 9.4% reduced use of materials and energy, while in Europe these percentages were 18.0% and 9.6% respectively.
Additionally, while public spending on R&D of GDP was lower in the Autonomous Community (0.35%) than in Europe (0.67%), private expenditure was higher, coming to 1.50% in the Basque Country compared to 1.21% in the EU-27.
Graph 2. Innovation dimensions in the Basque Country and in the EU-27. European Innovation Scoreboard EIS 2009
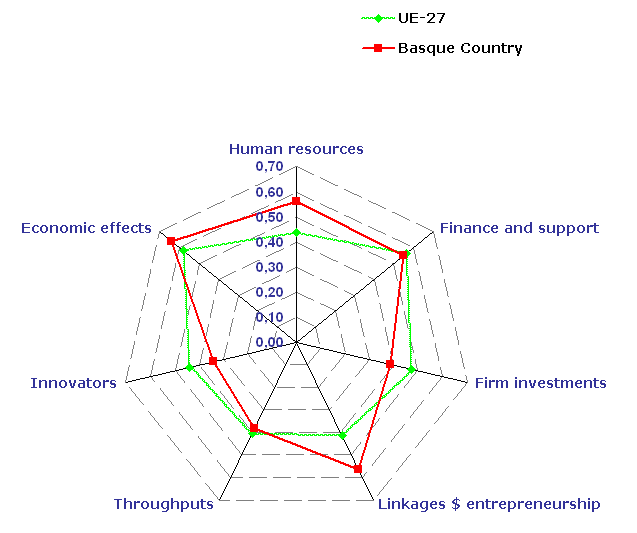
Source: Eustat and PRO INNO Europe: INNO-Metrics. European Commission
On the less positive side, there are also a series of indicators that still lag behind the figures for the European Union. Expenditure on innovation activities (not counting R&D) on sales in companies with 10 or more employees was lower (0.75% and 1.03% in the EU27).
Furthermore, the number of EPO patents per million inhabitants was 6.7 in the Basque Country, well below the European figure of 10.7. Elsewhere, the percentage of SMEs with non-technological innovations (in marketing or organisation), 27.1%, was far behind that obtained in the European Union, 40.0%.
Methodological note: The EIS 2009 Panel of Innovation Indicators is structured in 3 main blocks, which develop 7 different innovation dimensions for a total of 29 innovation indicators.
The “Enablers” innovation block includes the dimensions “Human Resources” and “Finance and support”. It has 9 indicators.
The “Firm Activities” block has 3 dimensions, “Firm investments”, “Linkages and Entrepreneurship” and “Throughputs”. It brings together 11 indicators.
The “Outputs” block brings together the dimensions of “Innovators” and “Economic Effects”. It includes 9 indicators.
For each one of the blocks and dimensions, as well as for the general scoreboard, a synthetic indicator is calculated whose value is between 0 and 1, using the same methodology for all European countries. Each indicator also uses the same reference year in all countries.
It is calculated with the 27 member countries of the European Union plus Croatia, Turkey, Iceland, Norway and Switzerland and sets out to classify these countries, measuring the degree to which economies of countries have the capacity and develop innovation activities
European Innovation Scoreboard EIS 2009
http://www.proinno-europe.eu/page/european-innovation-scoreboard-2009
For further information:
Basque Statistics Office
C/ Donostia-San Sebastián, 1 01010 Vitoria-Gasteiz
Tlf:+34-945-01 75 00 Fax:+34-945-01 75 01 E-mail: eustat@eustat.es
Contact: José Miguel Escalada
Tlf:+34-945-01 75 96 Fax:+34-945-01 75 01