Press Release 18/11/2009
2008 TIME ALLOWANCE SURVEY (EPT) 2008
Over the last fifteen years, the average time that the population spends on socialising (going out with friends, conversations, etc.) has fallen by 32 minutes
The average social time dedicated to the press and audiovisual media has increased by 5 minutes since 1993
According to the results of the Time Allowance Survey conducted by Eustat, the daily distribution of the time dedicated by the population to the different activities observed revealed certain changes that may indicate new trends in the social use of time.
The Time Allowance Survey is conducted every five years and had already been carried out three times in the past: 1993, 1998 and 2003. The latest data was collected in 2008 and we now have a 15-year sequence. Statistics calculates that the population residing in the Basque Country distributes the time it dedicates to the activities carried out during one day.
In 2008, and compared to 1993, the population aged 16 or over of the Basque Country, dedicated more time to meeting their physiological needs and personal care (+16 minutes), to work and/or training (+14 minutes), to active leisure and sports (+11 minutes), to travelling (+10 minutes) and to looking after other people (+ 9 minutes) and less on socialising (-32 minutes), which was similar to the time spend on domestic chores.
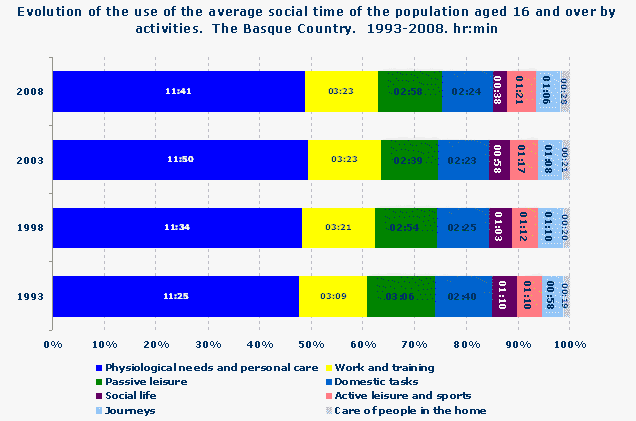
Specifically, in 2008, a “typical” citizen aged 16 or over in a “typical” day dedicated an average social time of 11 hours and 41 minutes to meting physiological needs and personal care, 9 minutes less than in 2003; he likewise spent 3 hours and 23 minutes to paid work and/or training, 2 hours and 24 minutes to domestic chores, 38 minutes to socialising (20 minutes less than in 2003), 4 hours and 19 minutes to leisure (23 minutes more than in 2003), 1 hour and 6 minutes to travelling and 28 minutes a day to looking after other people of the household, 7 minutes more than in 2003.
Over the last five years, less time was spent to eating inside the home while more time was spent eating out.
The distribution of time spent eating changed significantly over the last five years, as the time dedicated to eating at home fell by 21 minutes, as the population that did so was down by 1.1%. However, the time spent eating out increased by 3 minutes. We can, therefore, conclude that the average social time used for eating fell, even though the people who ate out took more time, 1 hour and 23 minutes (10 minutes more than in 2003), compared to those that eat at home, as the latter took 1 hour and 13 minutes (20 minutes less than in 2003).
Time spent sleeping (8 hours and 47 minutes), personal care (54 minutes), medical care (2 minutes) and social contact in other homes (4 minutes), did not significantly change with respect to the previous period.
Since 1993, the average social time that women dedicated to their main job increased, while that spent on domestic chore fell.
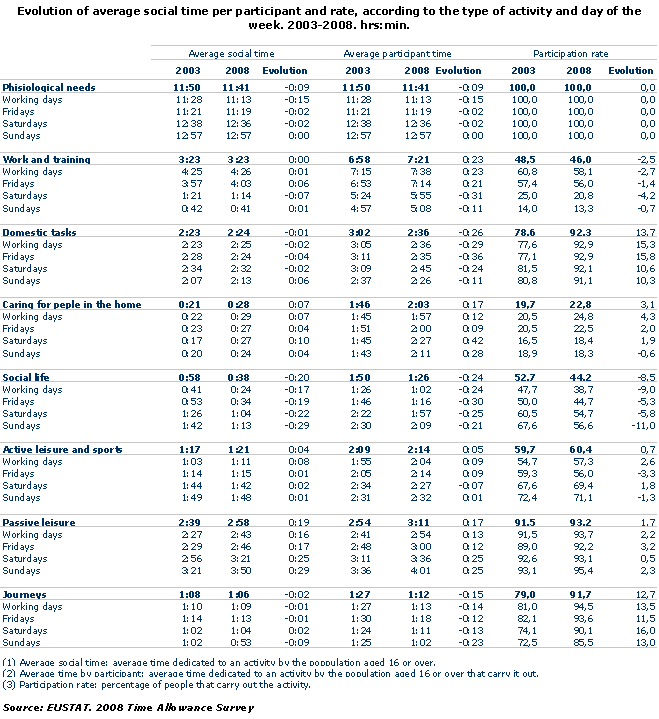
Total work time is taken to mean paid and unpaid work, that is, the time spent on household work, the average social time increased slightly over the 15 years in question, rising from 6.09 to 6.15 hours a day. Over the last 5 years, the time spent working of the working population increased by 12 minutes a day and the number of women in paid work rose. In addition, and only counting from Monday to Thursday, the time that the working population spend on paid work per day rose by 9 minutes. On the other hand, there was an increase in the time that people who work at weekend spent on paid work on Saturdays and Sundays, by 37 and 1 minutes, respectively.
If in 2003 women worked in paid employment 1 hour and 9 minutes less on average than men, the difference increased to 1 hour and 15 minutes in 2008. Only counting Monday to Thursday, the average working day for men on those days was 7 hours and 4 minutes in 2003, rising to 7 hours and 58 minutes, that is 54 minutes more in 2008. However, women on those working days only recorded a 5-minute increase, rising from 6 hours to 31 minutes in 2003 to 6 hours and 36 minutes in 2008. On the Fridays of 2008, men worked 23 minutes less and women up to 10 minutes less than on the other working days.
A substantial part of the variations detected in the use of time comes from the increase in paid employment by women. A gradual increase was noted in the average social time of women dedicated to their main work, rising from 1 hour and 15 minutes in 1993 to 2 hours and 9 minutes in 2008, and at the same time, a decrease in the time spent on domestic chores was noted, for example on preparing meals, which rose from 1 hour and 43 minutes to 1 hour and 25 minutes.
�
The male participation rate in the main professional work in 2008 was 43.5% and the female one was 32.7%, 3.3 percentage points down on 2003 in the first case and 1.9 percentage points up in the case of women.
Only 2 out of 25 people aged 16 or over said that they did not spend time on domestic chores, while the rest spent 2 hours and 36 minutes a day.
92.3% of the population carried out these tasks in 2008, 13.7 percentage point more than five years ago, but spent 26 minutes less on average than in 2003. Nonetheless, there was a slightly different distribution by day of the week: there were no variations from Monday to Friday, they spent 9 minutes more on Saturdays and 10 minutes less on Sundays. On the other hand, there was barely any difference in the time that men and women spent on these tasks. In 2008, women spent 3 hours and 33 minutes on domestic chores, 2 hours and 4 minutes more than men, while they used 2 hours and 6 minutes more than in 2003.
From the gender perspective, certain differences were noted in some of the activities related to the total work. In 2008, activities that are classified as clearly male one included repairs, as while women who stated that they did them dedicated 90% of the average time, the men in question spent 140% of the time; and formalities, as women who carried them out accounted for 7% of the average time and men 125%. Compared to 1993, certain differences were not with respect to the gender impact as, while repairs were the only activities classified as male, formalities were clearly carried out by men in 2008.
Likewise, clearly female activities in 2008 included preparing meals (136% of the average time spent on this activity was by women compared to 57% by men), looking after clothes (110% compared to 57%), cleaning (108% compared to 75%) and looking after children (117% compared to 77%). However, there were no great differences in others, such as non-regulated training, shopping or looking after adults.
Over the 15 years in question, the same activities were maintained, relating to total work, associated with women, that is to say, the same gender pattern, even though there was a notable reduction in the gender gap in the activities associated with cleaning domestic chores (cleaning the home, making the beds, tidying the rooms, separating or eliminating waste, etc.)
The participation and the average time dedicated to looking after children and adults increased among the domestic chores
22.8% of people aged 16 and over (3 percentage points higher than in 2003) spent a daily average of 2 hours and 3 minutes to looking after people in the household, either children or elderly relatives. There was an increase of 17 minutes per participant in relation to 2003. Men spent 1 hour and 41 minutes and women 2 hours and 18 minutes on this activity. The time spent looking after children was up by 21 minutes to 1 hour and 43 minutes. Opposite to what happened in 2008, looking after adults increased by 26 minutes in 2008, which meant that 2 hours and 9 minutes were spent on this activity.
�
Over the last five years, the average time spent on leisure - active leisure and passive leisure – increased by 23 minutes a day, while the average social time spent socialising fell by 20 minutes
93.2% of the population had time for passive leisure – press, television, shows, games etc.,- This percentage was up 1.7 percentage points on 2003, but the population overall spent an average of 2 hours and 58 minutes per day to this type of leisure, which was up 19 minutes during the last five years.
If the activities related to the information and circulation media – press and audiovisual – are analysed, there was an increase in the proportion of users of 6.3 percentage points, rising to a rate of 90.8% in 2008. They spent an average of 2 hours and 54 minutes on the aforementioned media, 26 minutes more than in 2003. That time increased by 30 minutes in the case of men and 22 for women.
On the other hand, 11.5% of the population said that they spent 1 hour and 1 minute on relaxing, thinking, not doing anything, 10 minutes less than five years ago.
The average social time dedicated to active leisure – sports, walking or going on trips, browsing online, etc. - was 4 minutes higher than in 2003. 60.4% of the population carried out activities included in this section, which was 1% increase on the previous five-year period. The leisure related to ICT technologies has increased considerably over recent years and, on average, the population spent 13 minutes a day on the computer and in Internet, nearly double than five years ago. Men have a higher participation than women on those activities.
In fifteen years, the average social time spent on socialising fell from 1 hour and 10 minutes to 38 minutes
While the average time per day spent on leisure, both active and passive, increased over the last five years, the population that spent time on activities related to socialising continued to decrease. Just under half the population aged 16 or over (44.2%) spent 1 hour and 26 minutes a day on activities related to socialising: visiting friends, chatting, taking part in political parties or association, to religious practices etc. Over the last five years, the proportion of the population that carries out these activities (-8.5 percentage points) fell, along with the average time spent by those that effectively carried them out (fell by 24 minutes).
13.3% of the population said they spent time on visiting friends or receiving them, in going out for snacks or for a drink, or going to a party or dances, which was significantly lower than the 18.2% in the 2003 survey. The average time spent by this group a day came to 2 hours, 5 minutes less than five years ago.
The time spent talking, particularly face to face, also fell by 23 minutes a day down to 52 minutes a day spent on this activity. On Saturdays and Sundays, it rose slightly to 1 hour & 1 minutes and 1 hour & 4 minutes, respectively.
�
People from Bizkaia slept less and spend most time on news and dissemination media and on looking after people in the household; those from Álava spent most time working, training, socialising and those from Gipuzkoa were the ones that use most time for physiological needs, domestic chores and travelling.
Residents of Bizkaia slept 8 hours and 43 minutes a day, 12 minutes less than those from Gipuzkoa and 3 less than those from Álava. In the case of the latter, they spent a daily average of 7 hours and 29 minutes working, 14 minutes than those from Bizkaia and up to 19 minutes more than the people living in Gipuzkoa.
The students in Álava, who were following regulated studies, spent 26 minutes more a day studying and going to class than their counterparts in Bizkaia and 40 minutes more than in Gipuzkoa, who spent an average of 4 hours and 43 minutes a day.
17.3% of the residents of Álava usually visited or were visited by friends, went for tapas or similar activities that would be taken to be socialising, spending on average 2 hours and 13 minutes, 15 minutes more than the residents of Bizkaia and 19 more than those from Gipuzkoa.
The residents of Gipuzkoa were the ones who regularly talked on the phone or speaking to friends and relatives in the highest proportion, up to 36.6%, while the percentage of people living in Álava came to 25.4% and in Bizkaia 33.3%. Nonetheless, those in Álava spent 1 hour and 7 minutes on average each day talking, 10 minutes more than the people in Vizkaia and 26 more than those in Gipuzkoa.
People living in Álava spent 1 hour and 45 minutes doing sports, 12 minutes than those from Gipuzkoa and 16 more than those in Bizkaia.
Residents of Bizkaia spent most time listening and reading the media: 3 hours and 1 minute a day, 5 minutes more than those from Gipuzkoa and 22 more than those from Álava. Residents in Bizkaia also spent 2 hours and 10 minutes looking after other people in the household, 2 minutes more than those in Álava and 20 minutes more than the residents of Gipuzkoa.
�
For further information:
Basque Statistics Office
C/ Donostia-San Sebastián, 1 01010 Vitoria-Gasteiz
Tlf:+34-945-01 75 00 Fax:+34-945-01 75 01 E-mail: eustat@eustat.es
Contact: Pilar Martinez Rollón
Tel:+34-945-01 75 97 Fax:+34-945-01 75 01
Online press releases: www.eustat.es