This project was born out of the need to reduce the burden of the Survey on the Information Society in Companies (ESIE) for respondents. In particular, it focuses on one of the questions in the questionnaire, which asks about access to social networks on the website.
By using scraping techniques, we were able to automatically identify this question. The results obtained show that these techniques are effective in detecting and analysing this type of information.
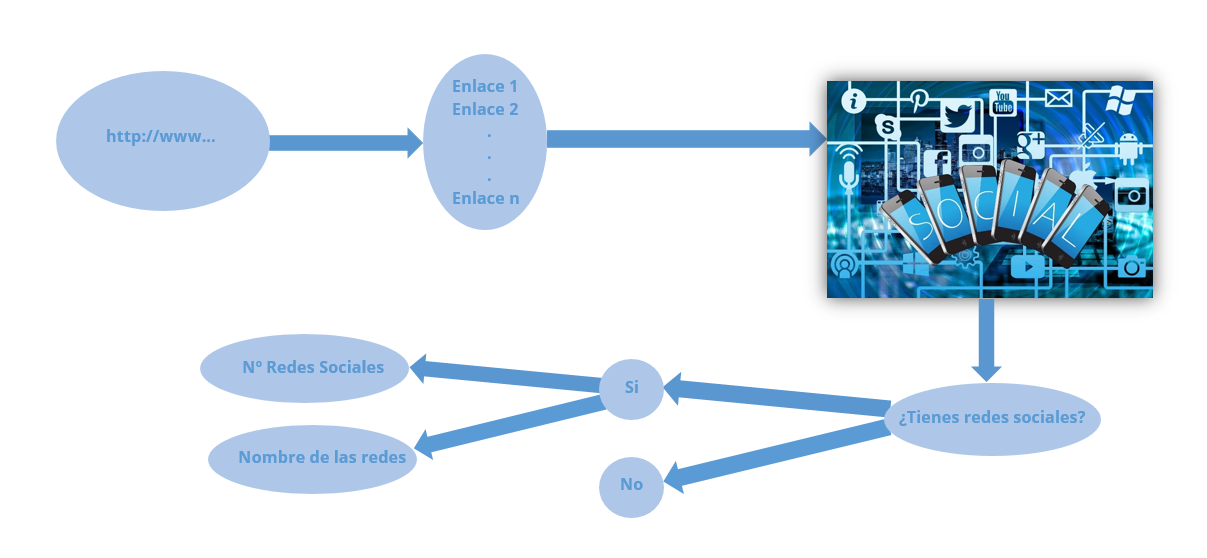
For each company, we access the corresponding URL and, using scraping techniques, browse both the home page and the available links. During this process, the associated social networks are identified and extracted.
The evaluation was conducted by comparing the results obtained from scraping with those collected in the Survey on the Information Society in Companies (ESIE) regarding the variable of the presence of social networks on company websites. The evaluation of the project was carried out using the answers given in the surveys from two consecutive years (2022 and 2023).
Accuracy:
Measures the proportion of correct predictions (true positives and true negatives) out of the total number of predictions.
Accuracy = TP + TN / (TP + TN + FP + FN)
Accuracy stood at 83% in 2022.
Accuracy stood at 85% in 2023.
Sensitivity:
Clearly identified true positives.
Sensitivity = TP / (TP + FN)
Sensitivity stood at 78% in 2022.
Sensitivity stood at 81% in 2023.
Specificity:
Clearly identified true negatives.
Specificity = TN / (TN + FP)
Specificity stood at 95% in 2022.
Specificity stood at 96% in 2023.
Positive Predictive Value (PPV):
Proportion of positives predicted by the model that are actually positive.
Specificity = TN / (TN + FP)
The PPV was 97% in 2022.
The PPV was 98% in 2023.
When the model predicts that the website has social networks, there is a 98% probability that the prediction is correct.
Negative Predictive Value (NPV):
Proportion of negatives predicted by the model that are actually negative.
Negative Predictive Value (NPV):) = TN / (TN + FN)
The NPV was 64% in 2022.
The NPV was 66% in 2023.